


The sobriquet, the Land of Seven Sisters, coined by journalist Jyoti Prasad Saikia, are the contiguous states of Arunachal Pradesh, Assam, Meghalaya, Manipur, Mizoram, Nagaland and Tripura in northeastern part of India, often regarded as the home of great ethnic and religious diversity.
However, Dr. B. Datta Ray, veteran freedom fighter, and S.P. Agrawal in their book "Reorganization of Northeast India Since 1947" rightly quotes “No region in India has undergone such fragmentation as North-East has in the last four decades since Independence”, greatly owing to the immense diversity of the region. From one Indian state (Assam) and two princely states (Manipur & Tripura) in 1947 to seven Indian States today with insurgent demands of many other states across, the region has witnessed a lot of ups and downs over the years resulting in a difficult state of affairs.

This interactive data visualization tries to portray the changes Northeast India has witnessed across various political, social and economic spheres over the past 70 years since India attained independence in 1947. During data research, I framed various questions, based on my hypotheses, addressing some imminent and conspicuous socio-political and socio-economic aspects concerning the region of northeast India over the past 70 years.
How was the Independence of India celebrated in Northeast India on 1947? How has the region fared under Emergency or Natural Disasters? What has been the impact of politics on the region over the last 70 years? How has territorial divisions occurred in the Northeastern part of India since Independence? Often regarded as the Home of Biodiversity, how has northeast India maintained its rich resources? What has been the impact of immigration, extremism, insurgency and AFSPA in the region over the last 7 decades? Has the region grown in par with the rest of India in terms of economy, literacy, population, cost of living, basic amenities? Who encourages these separatist movements against states?
The narrative for this data visualization was driven by both quantitative and qualitative data and hence various such datasets were collected for each of the seven states, structured and transformed for quality and analysis.
Quantitative Dataset
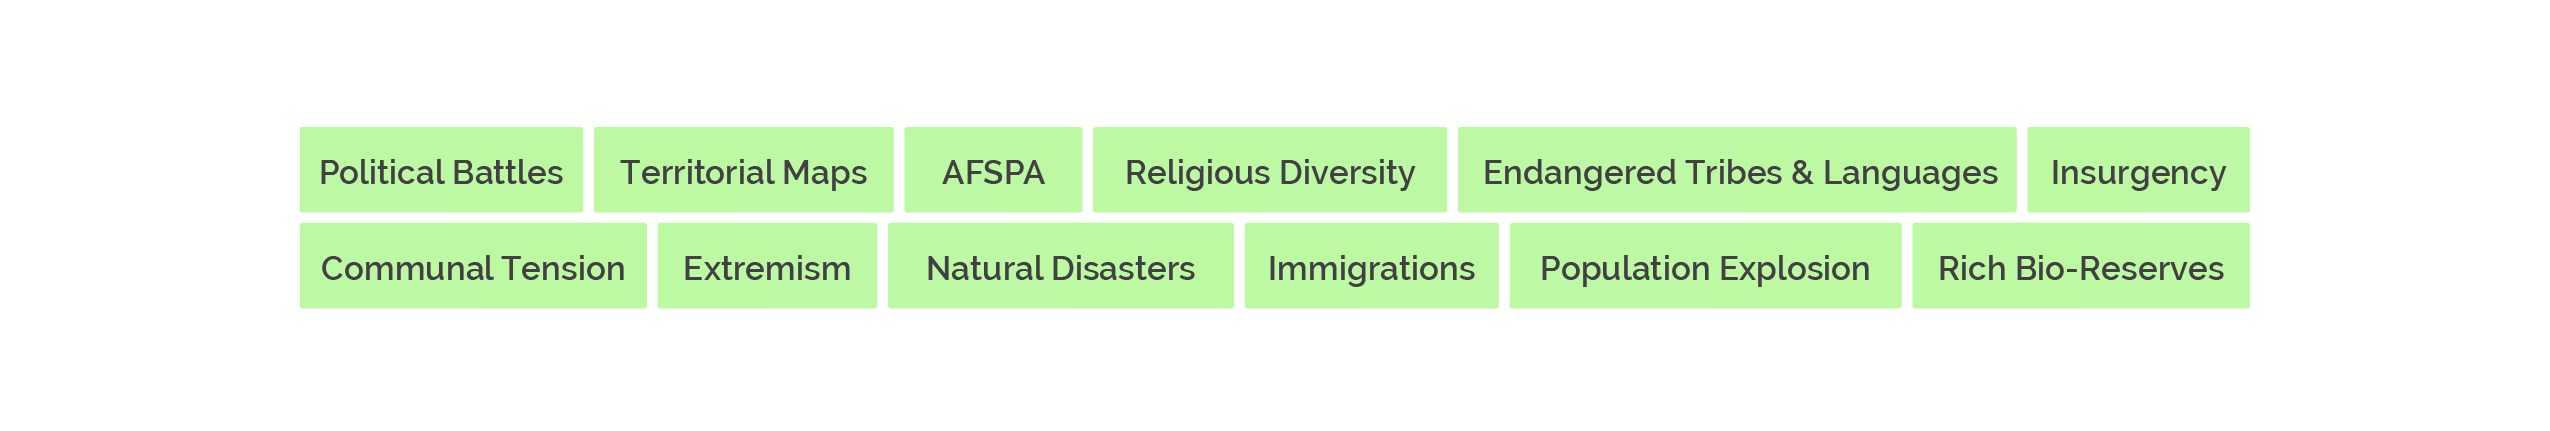
Qualitative Dataset
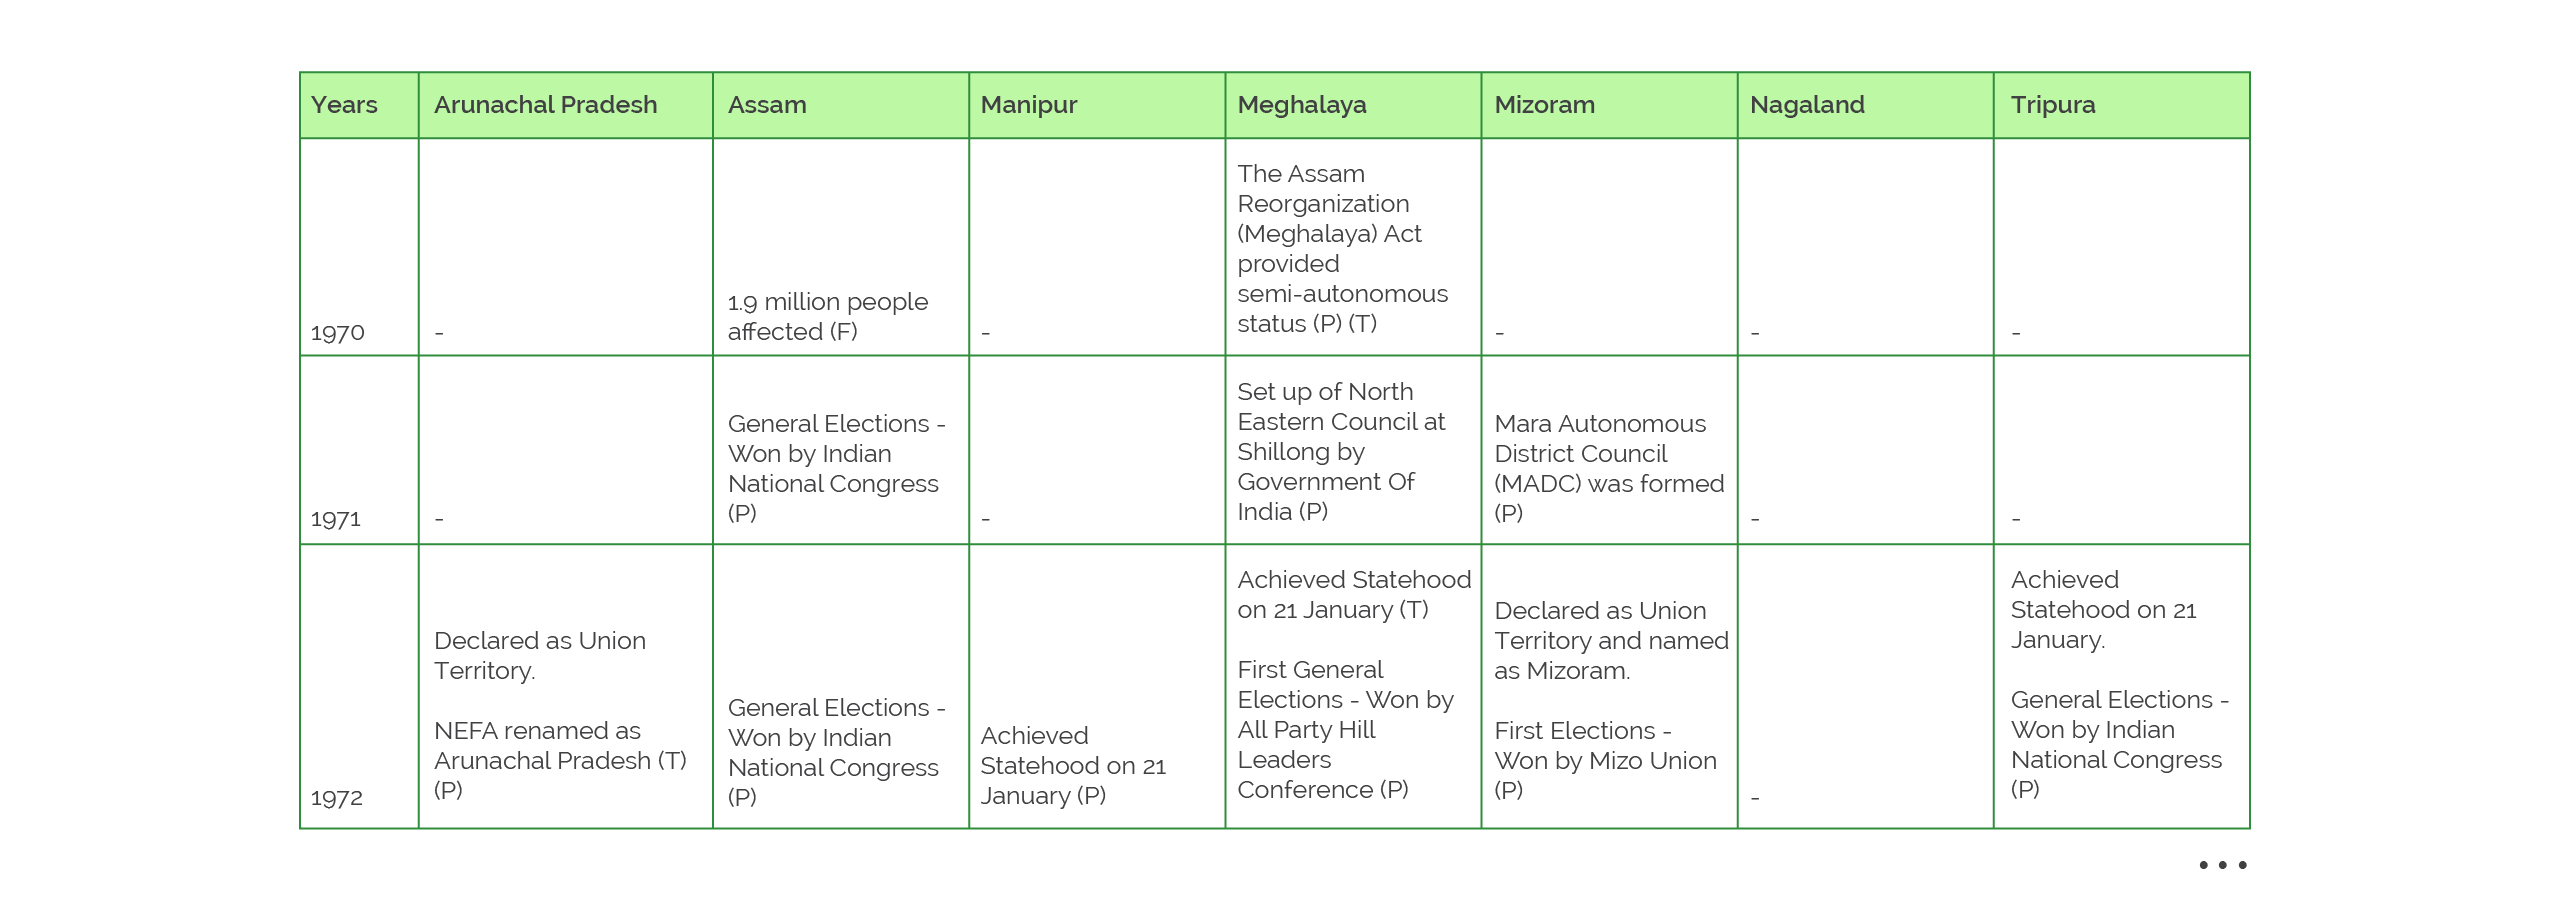
 AFSPA (A), Bio-Reserves (B), Floods (F), Insurgency (I), Political (P) and Territorial (T) activities.
Consolidated quantitative and qualitative data snippet.
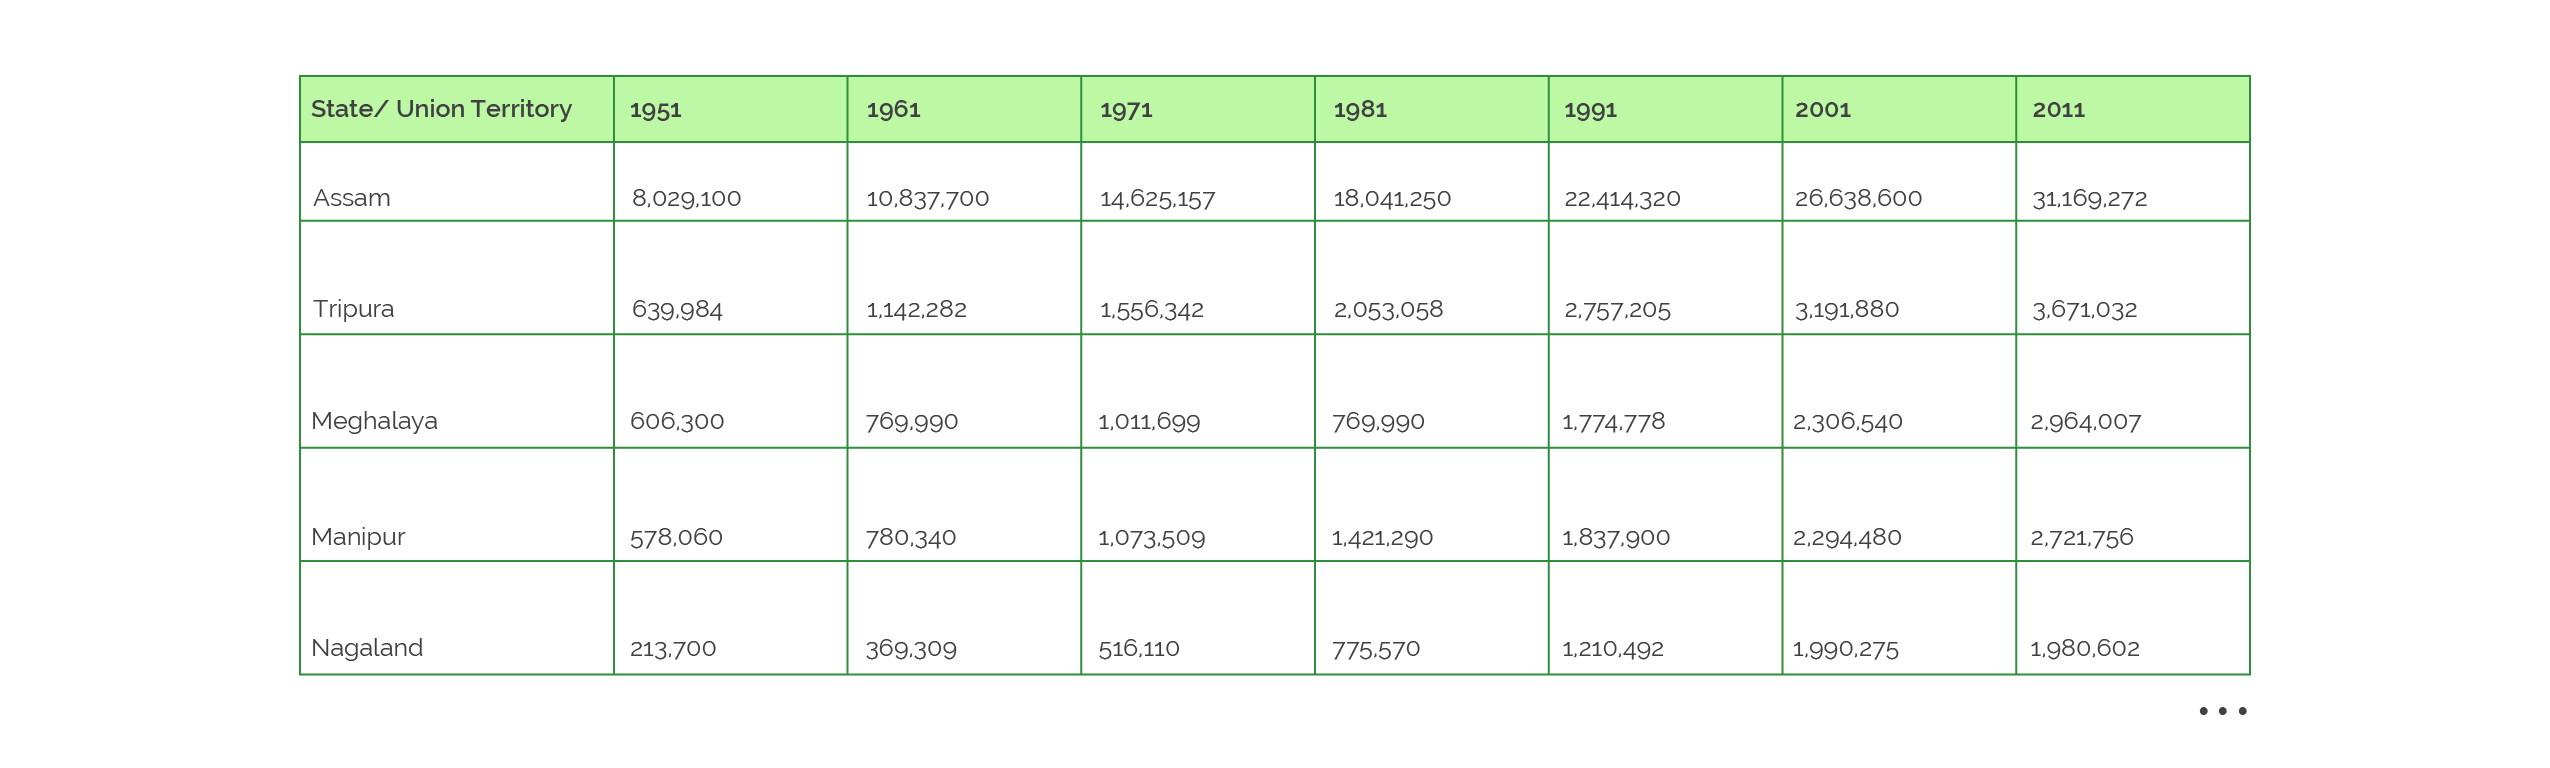
 Statewise population growth based on census data.
Consolidated quantitative data snippet.
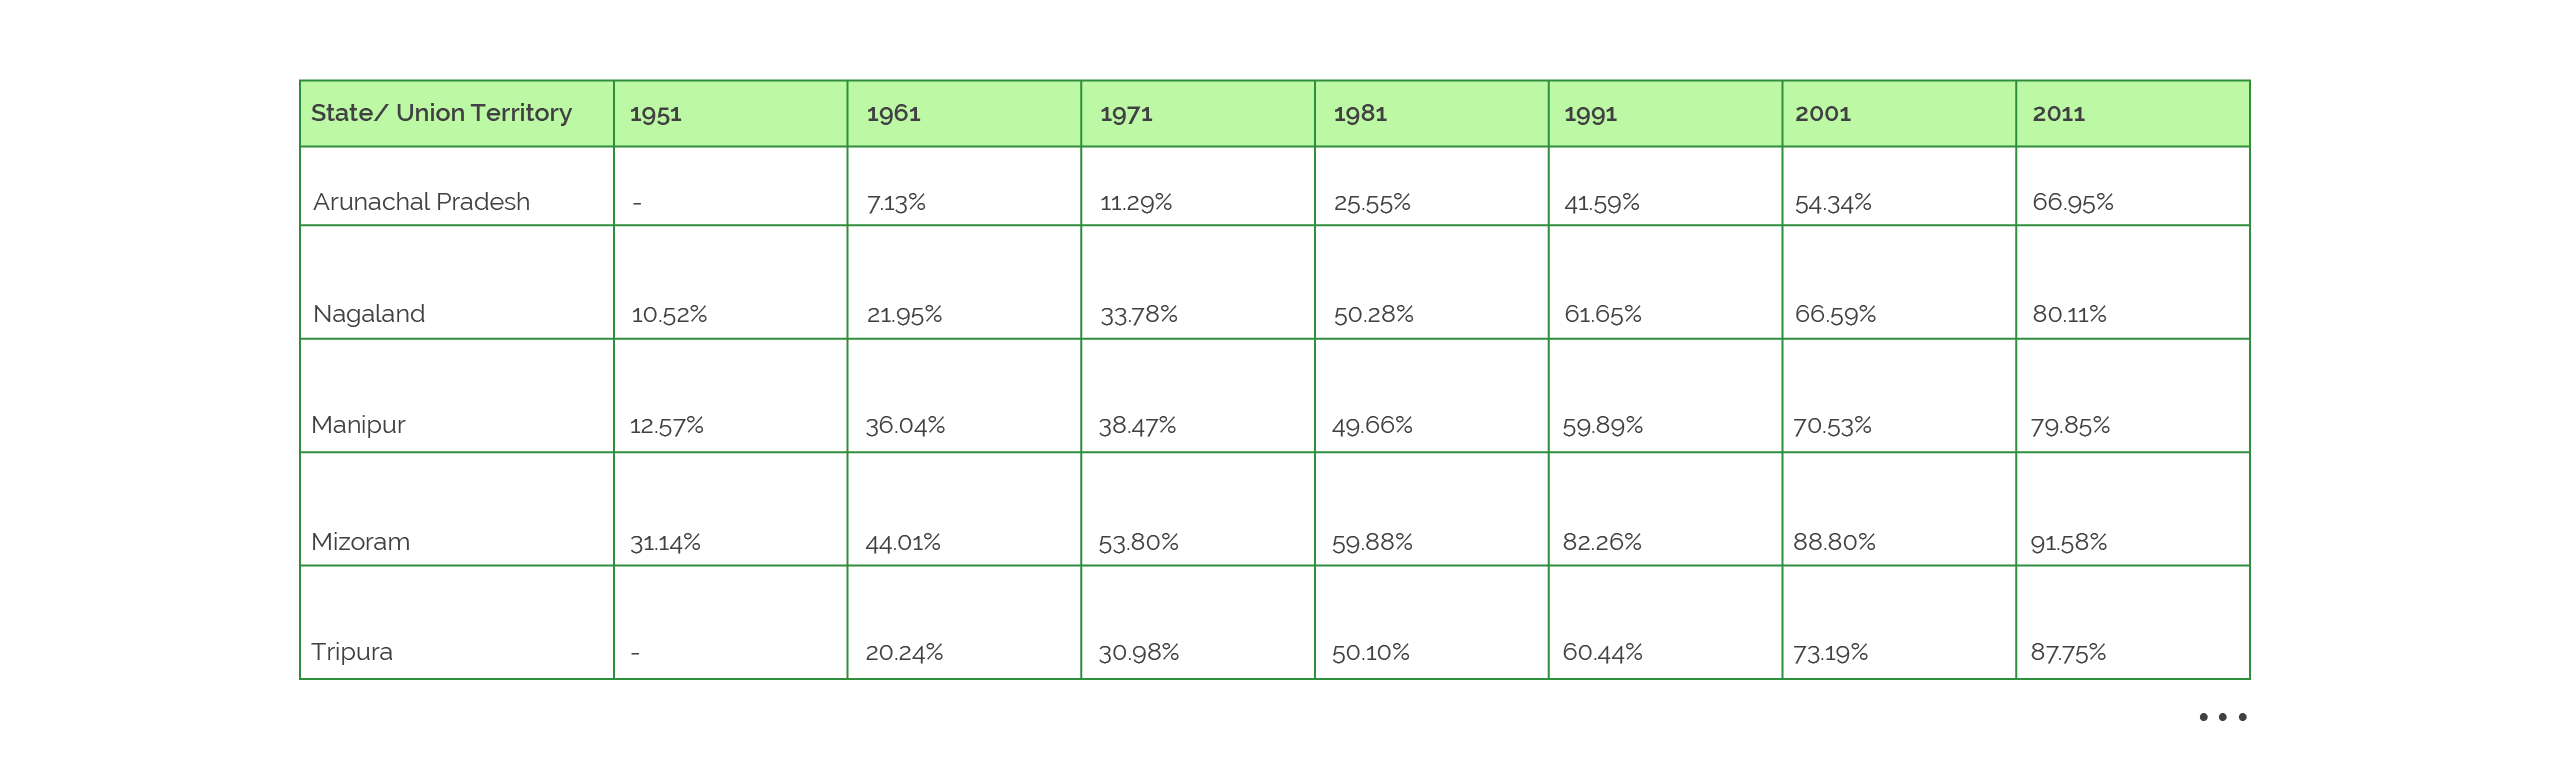
 Statewise literacy rate based on census data.
Consolidated quantitative data snippet.
8 integral data categories were aggregated from research which were mapped across 8 geographic entities of the map:


ASSAM

ARUNACHAL PRADESH

MANIPUR

MEGHALAYA

MIZORAM

NAGALAND

TRIPURA

THE SEVEN SISTERS
Considering the various patterns, trends and correlations in the categorical and quantitative datasets of the seven states, a timeline data representation technique was adopted and various layouts were wireframed. Three dimensions/data coordinates were derived for the visualization, namely:
Year
Location

Data Group
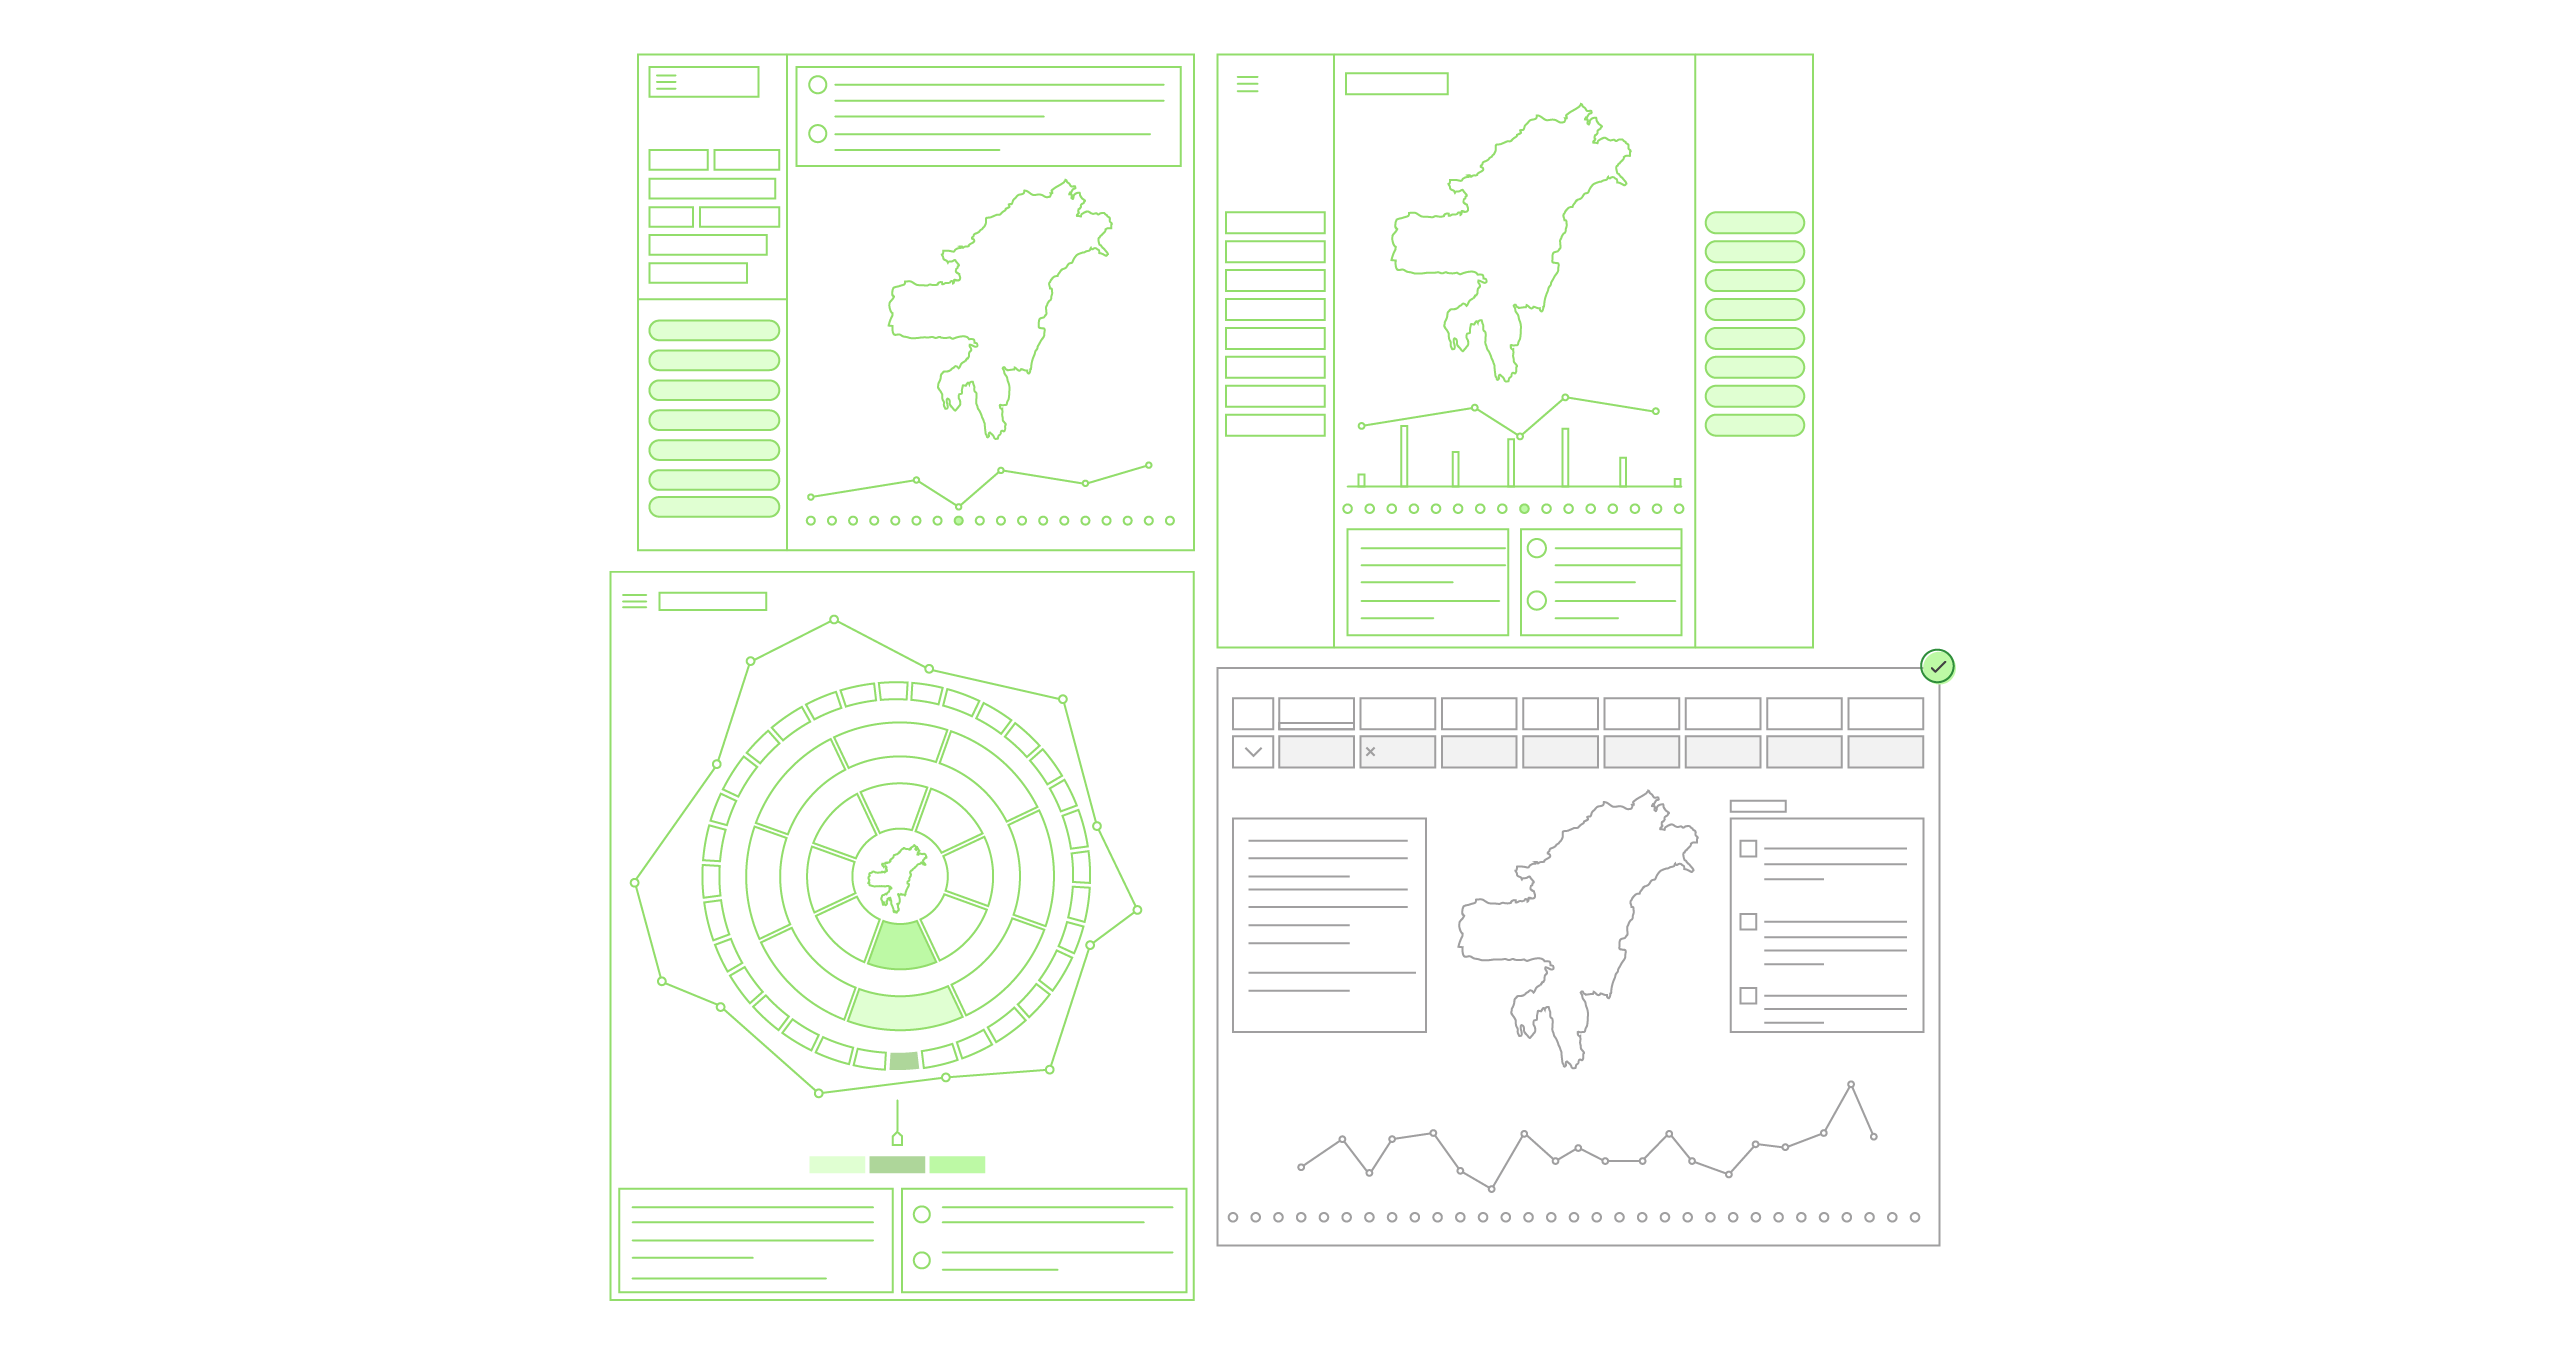
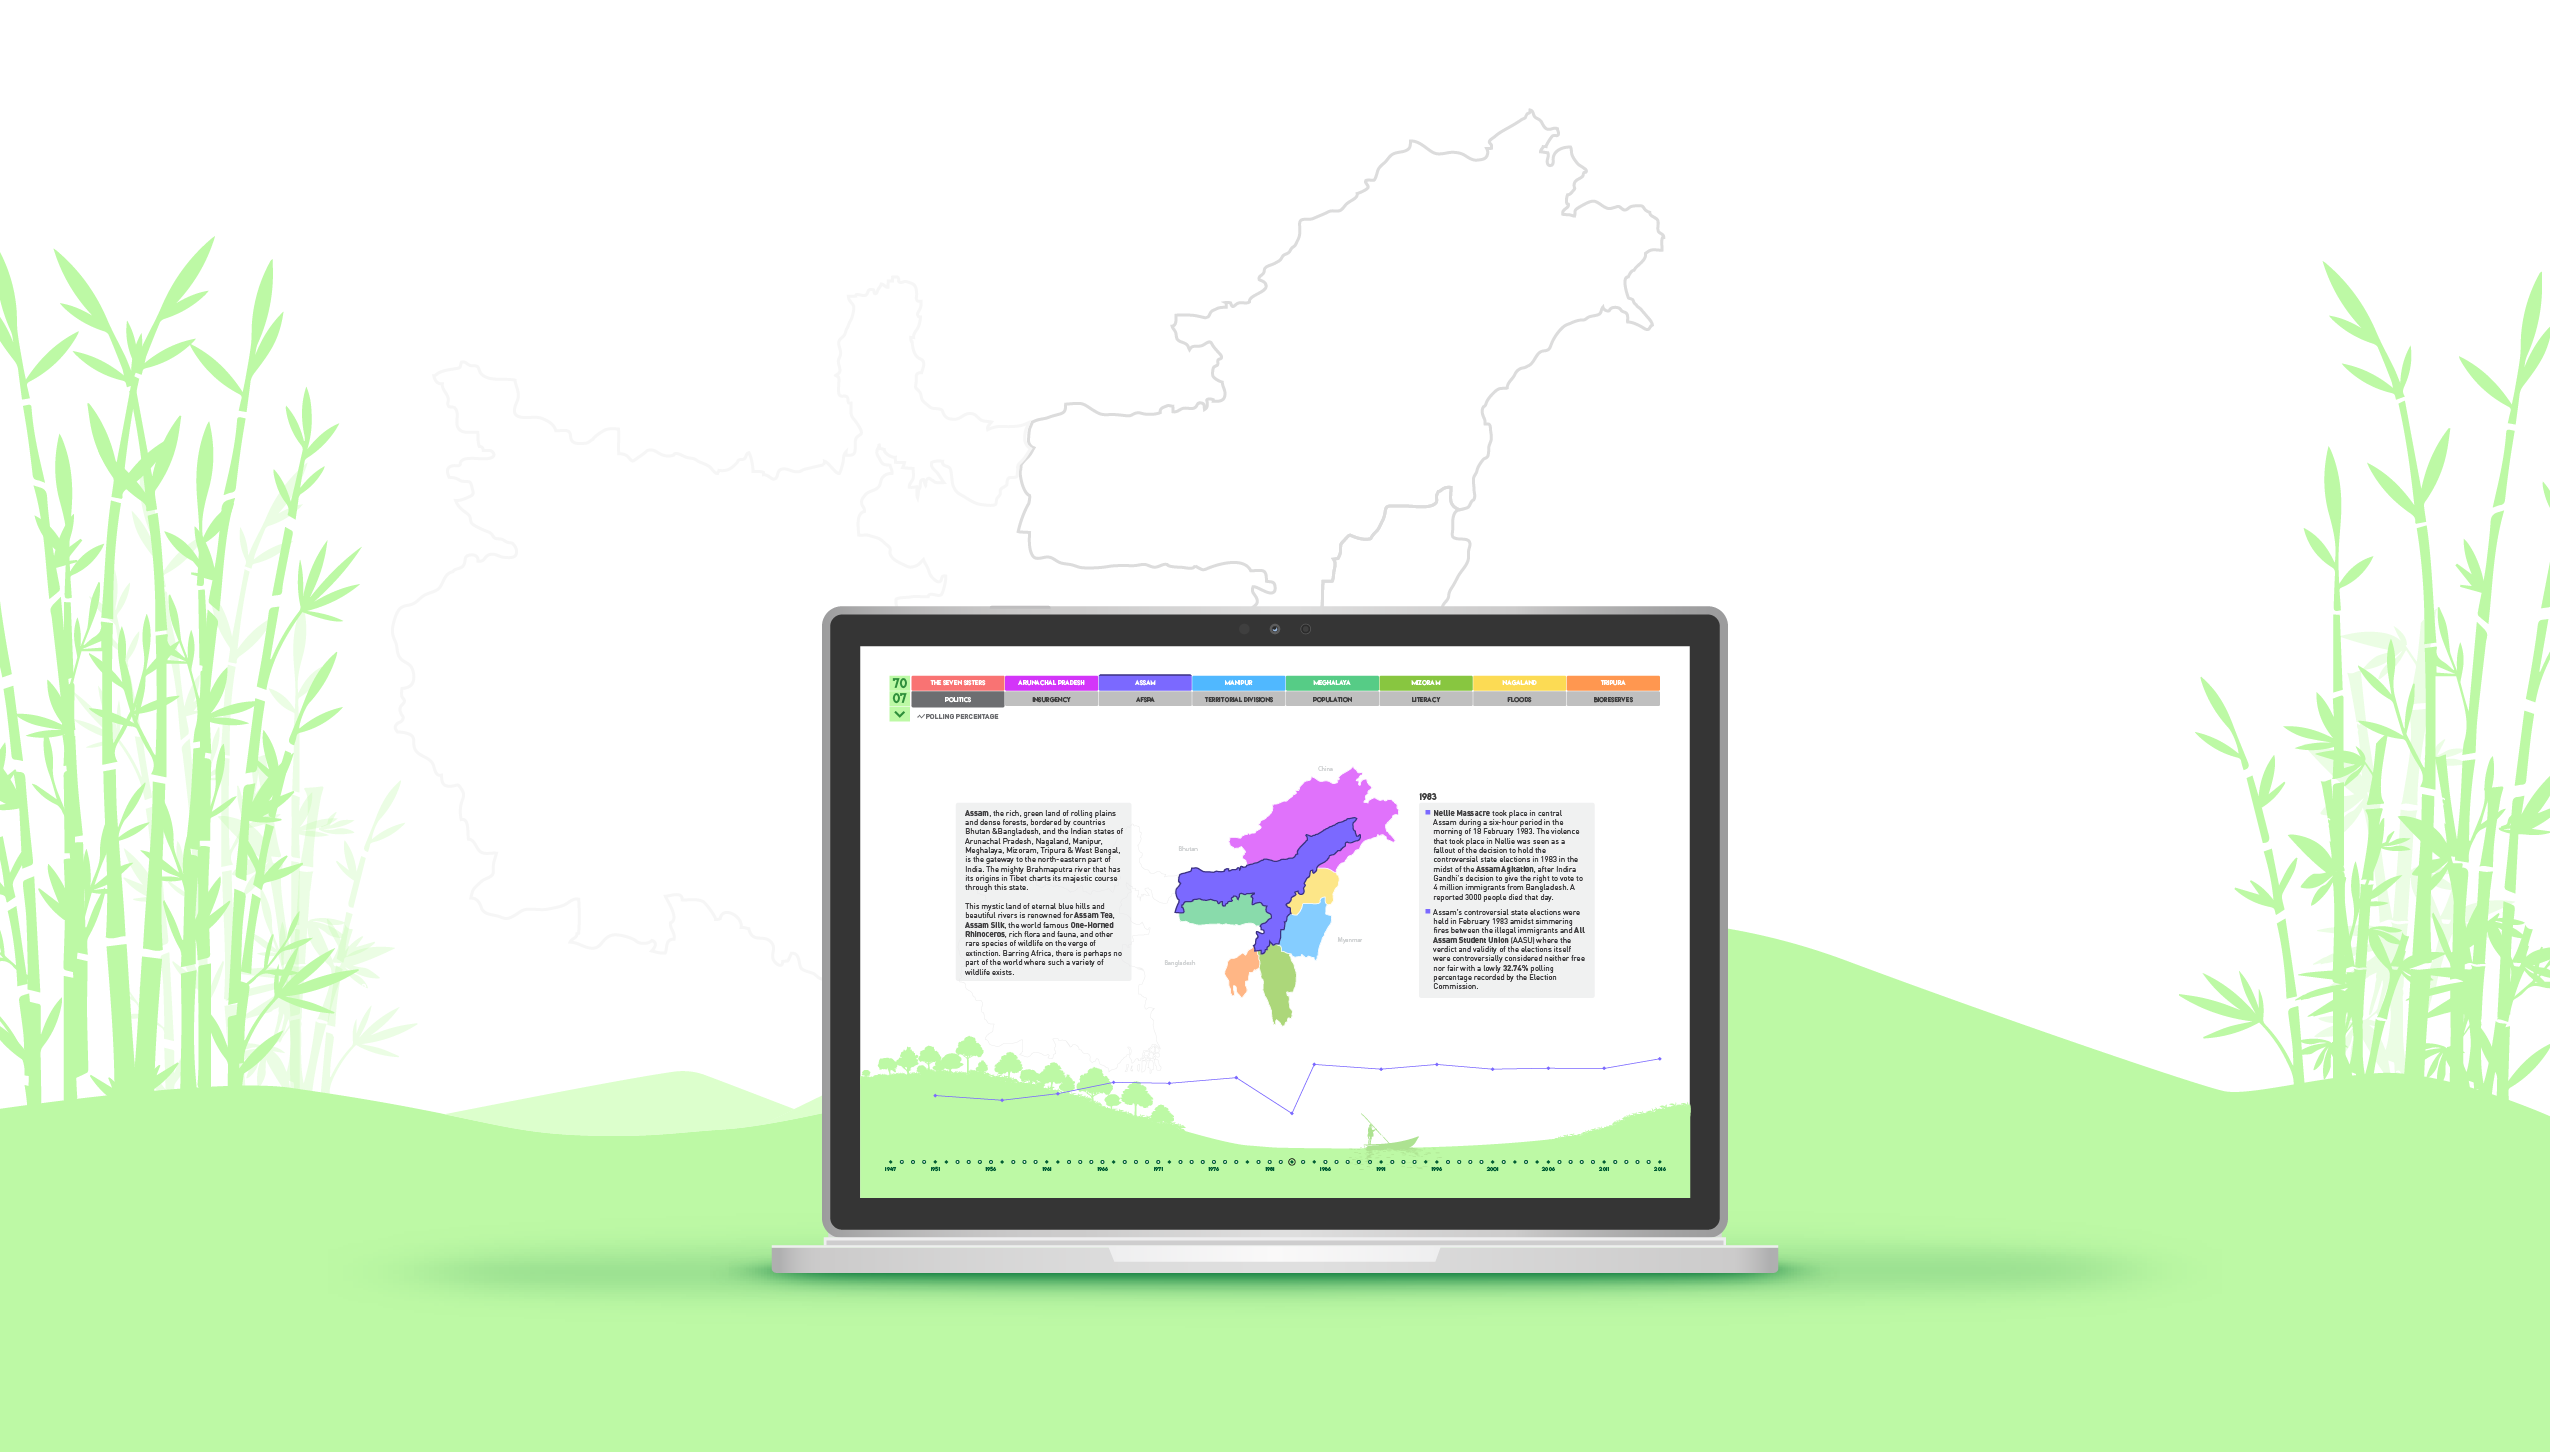
The final visualization provides an Exploratory Approach with a header section which accomodates the locations and data groups while the footer section represents the years. A left data box is used for a brief intro about the geographic entity while a right box is used for contextual event information along a centrally placed interactive map of the area.

Explorative


Inquisitive

Explorative

Cognitive
An onboarding experience was designed to provide an introduction to Northeast India and help users understand interactions.
If the above video doesn't load properly, alternatively you can watch it here.
Onboarding screens are often designed specifically for first time users, however here the user is provided with an option to re-visit it from the "See Intro" menu option at any time. Some highlighting features from the data viz. are:
Illustrative landscapes for different geographic entities signifying the essence of that place.
An interactive map to emphasize and ease up location based navigations.
Archetypical visual language to depict the quantitative data groups.
Retrieve actuals on cursor hover over any graph plot to explore trends and correlations.

Alternatively you can check it out at: Marvel Mid-Fi Prototype.
A FEW DATA SOURCES
www.dhemaji.nic.in/flood/flood_history.htm
http://eci.nic.in/eci_main1/ElectionStatistics.aspx
https://data.gov.in/catalog/state-wise-literacy-rates
www.satp.org/satporgtp/countries/india/states/tripura/index.html
https://en.wikipedia.org/wiki/List_of_states_in_India_by_past_population
MS Excel
Adobe Illustrator
Adobe After Effects
Tableau


This work is licensed under a Creative Commons Attribution-NonCommercial-NoDerivatives 4.0 International License. © All Rights Reserved 2019.

