

BeZero is a system design project which tries to understand our Municipal Solid Waste Management Systems and deals with increasing consumerism of our urban world which is rapidly becoming a global menace. To build a sustainable future for ourselves, the need of the hour is to start preaching, practicing and educating our future generations to move towards the macrotrends of Circular Economy and Zero Waste Living.
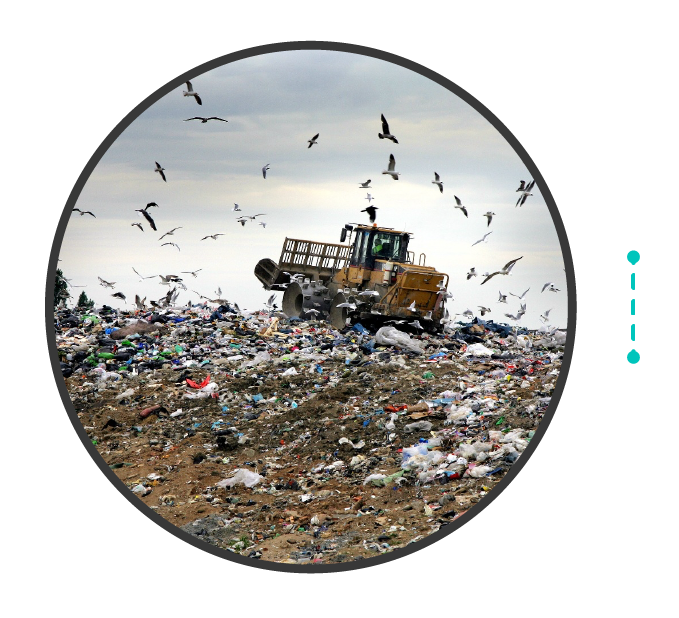
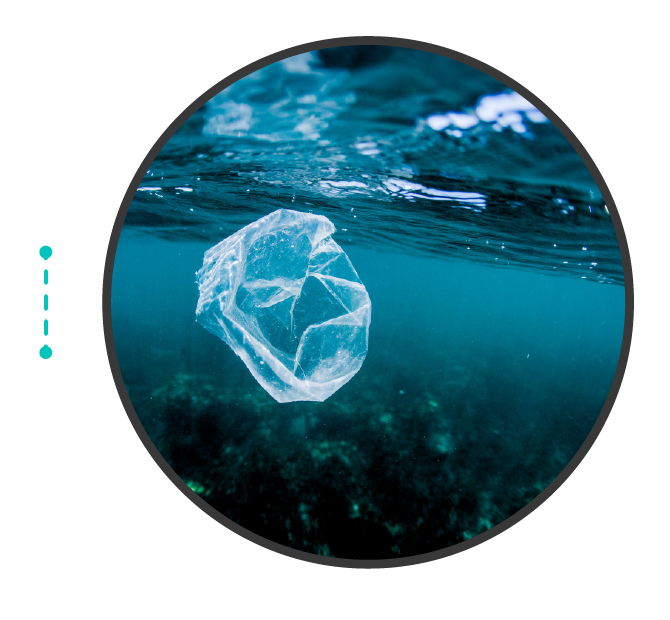 The Ellen MacArthur Foundation report of 2016 states that, in a BAU, Business-As-Usual, scenario by 2050 there will be more waste plastic (850 Million Tonnes) in the sea than fish (812 Million Tonnes). Today, 95% of our plastic consumptions end up in our fragile ecosystems, the oceans and landfills.
How big is 278%?
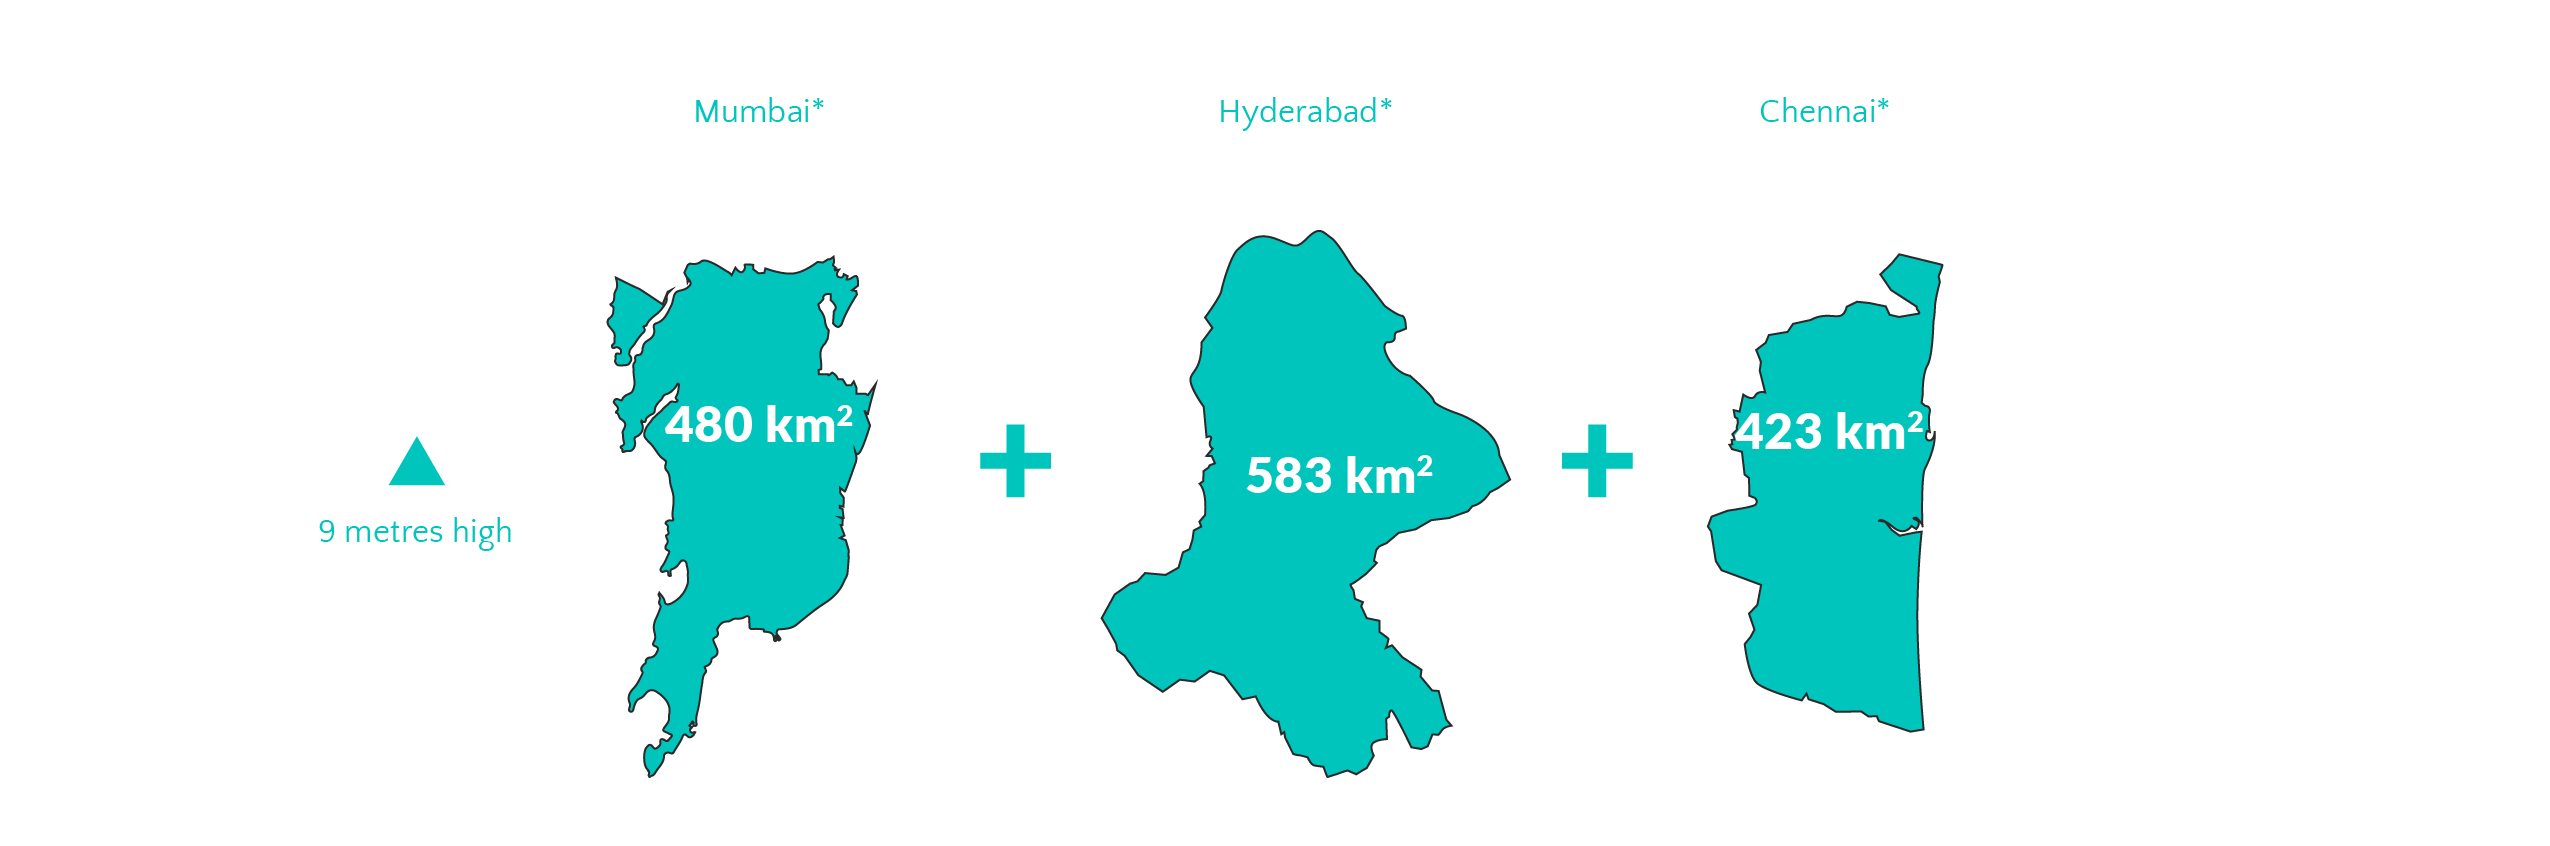
More than 1400 sq. km of land stacked 9 metres high, would be required for the disposal of 278% increase in waste generation, which was then the cumulative land area of Mumbai, Hyderabad and Chennai.
*Land areas mentioned here are as per 2009, when the Position Paper was published by Ministry of Finance, Govt. of India
Solid Waste Management systems of Berlin, Germany, considered one of the most efficient in Europe, and Bengaluru, India, one of the efficient urban Indian models, were studied in details to find out key learnings.

• An efficient Waste-to-Energy Model with 95% recovery rate and 43% recycling rate.
• 80% of MSW comes from households but Residual/Mixed waste remains a big concern.
• Total waste generated is 1.48 million TPY with an average per capita generation of 0.9kg/day.
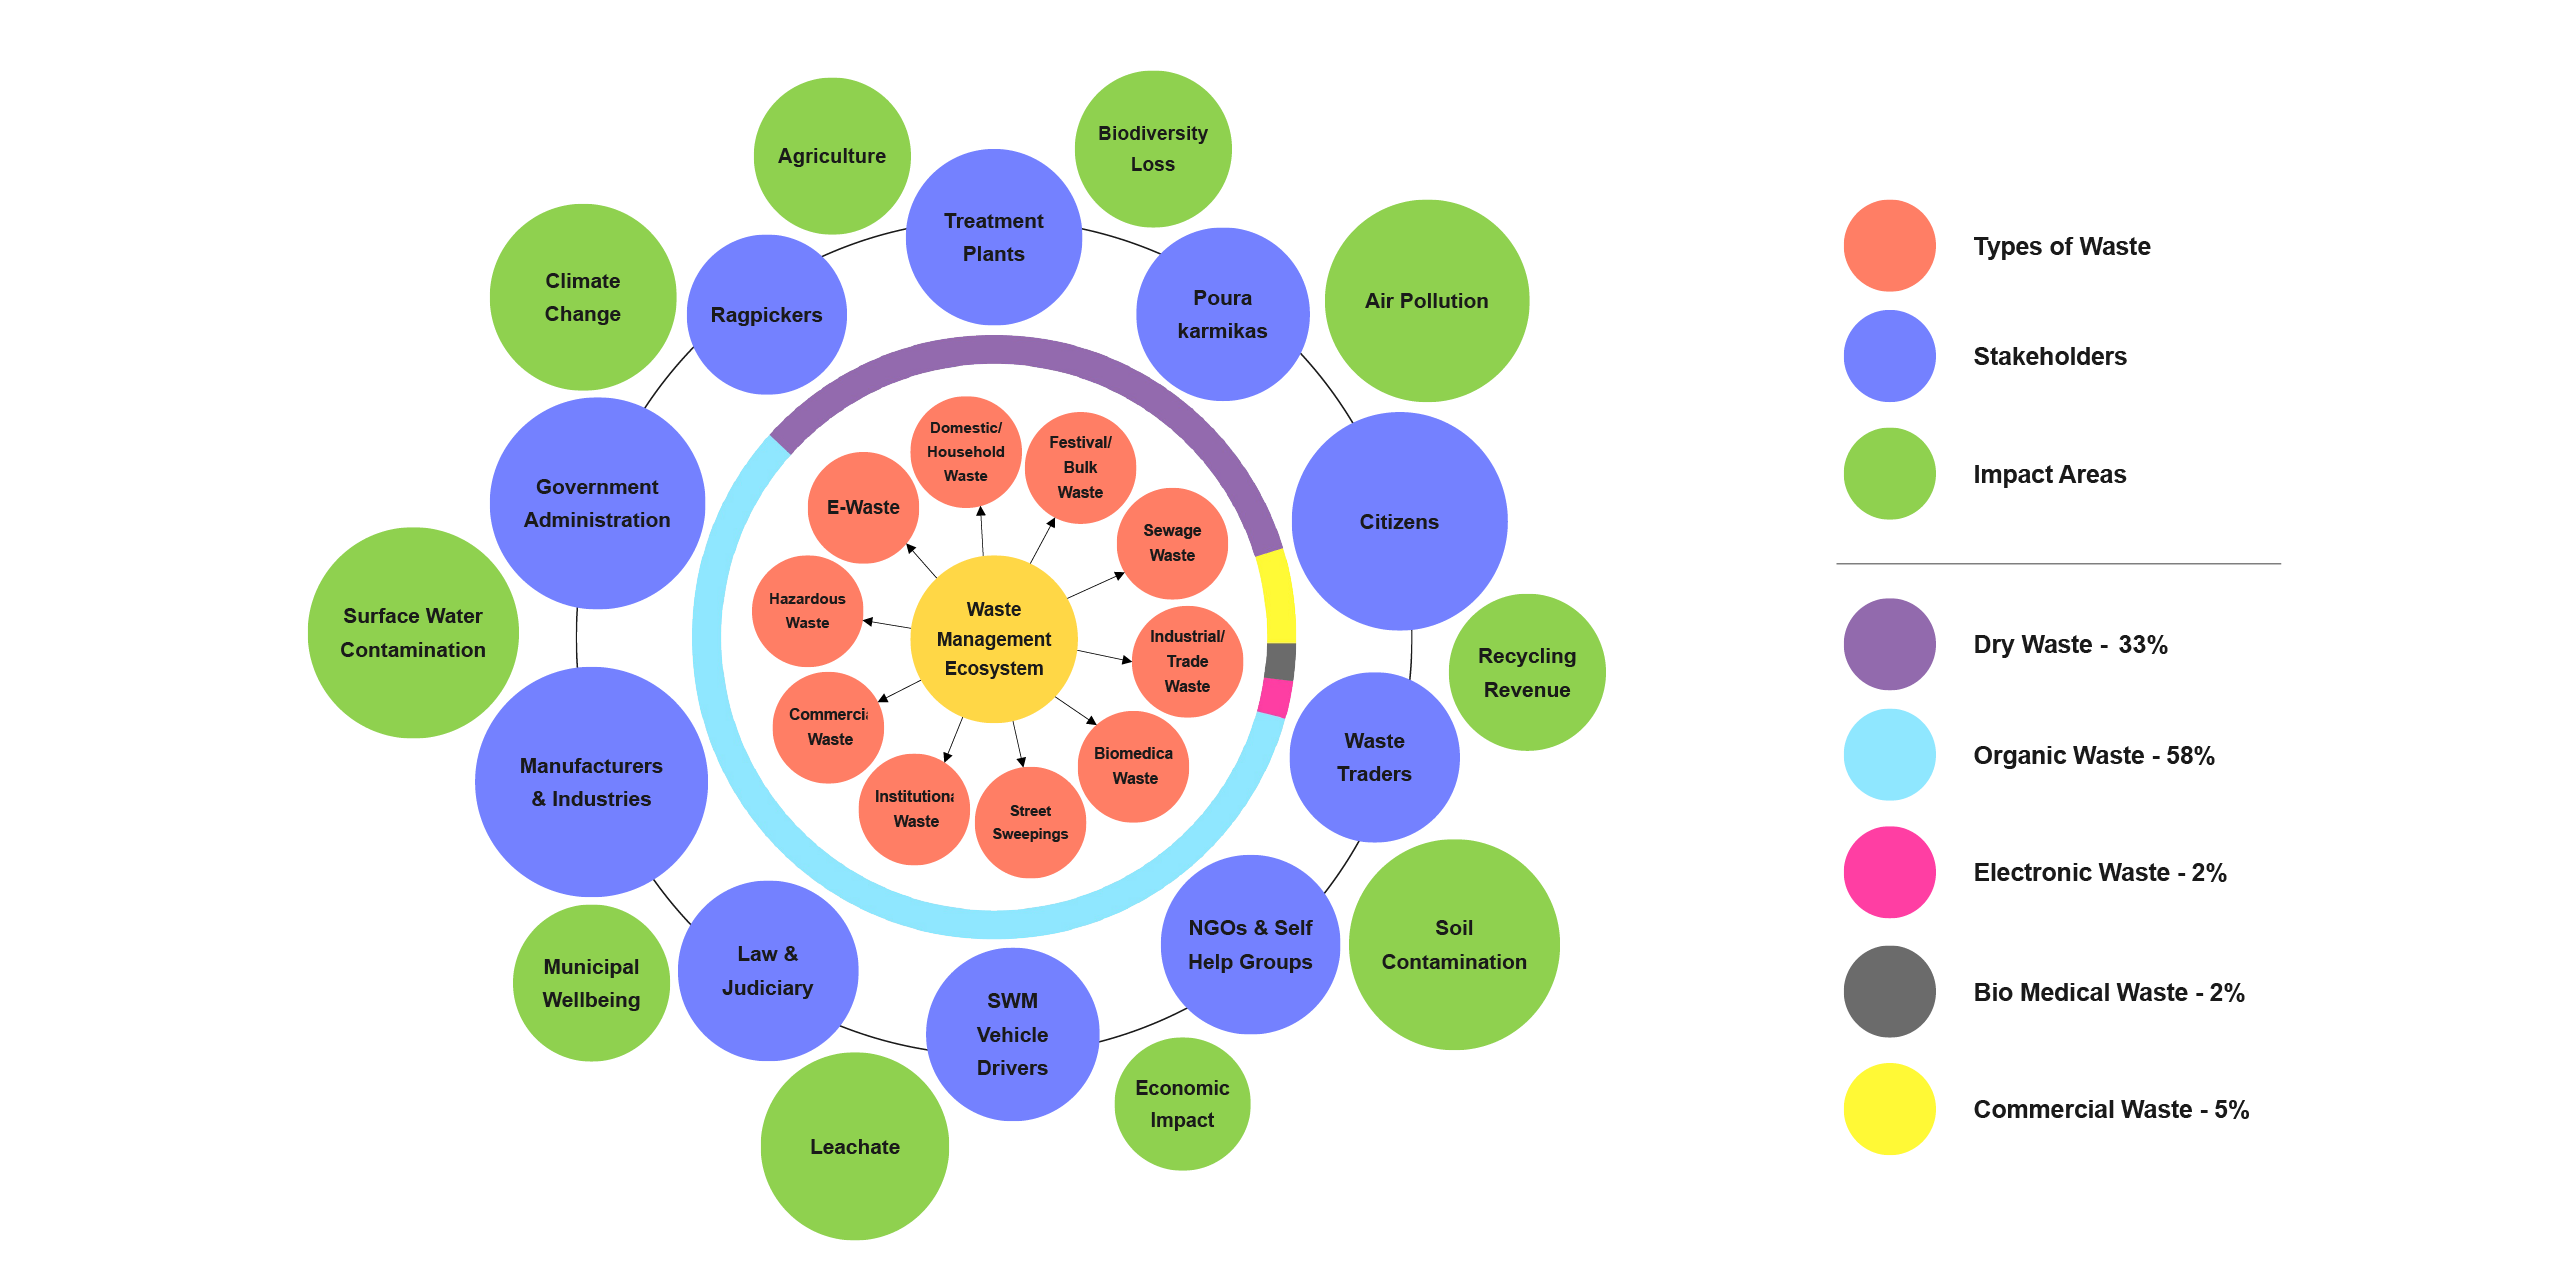

• A well defined decentralized SWM Plan with various Waste-to-Energy (WTE) models.
• 85% of MSW comes from households of which 80% is Mixed waste and reaches the landfills.
• Total waste generated is 1.80 million TPY with an average per capita generation of 0.5kg/day.


Household waste contributes to majority of the Municipal Solid Waste.
Concrete waste management plans and efficient WTE models are available to counter it today.

Per capita waste generation rate is on the rise with rapid urban growth and population explosion.

A comparative study of both the systems infer that although present SWM plans and models are fairly suitable to handle the waste today but simply managing the generated waste alone cannot be a viable option for the future because the exponential increase in our average per capita waste generation is alarming.
…conventional waste management systems are not well suited to deal with increased waste generation rates…
[United Nations Environmental Programme]
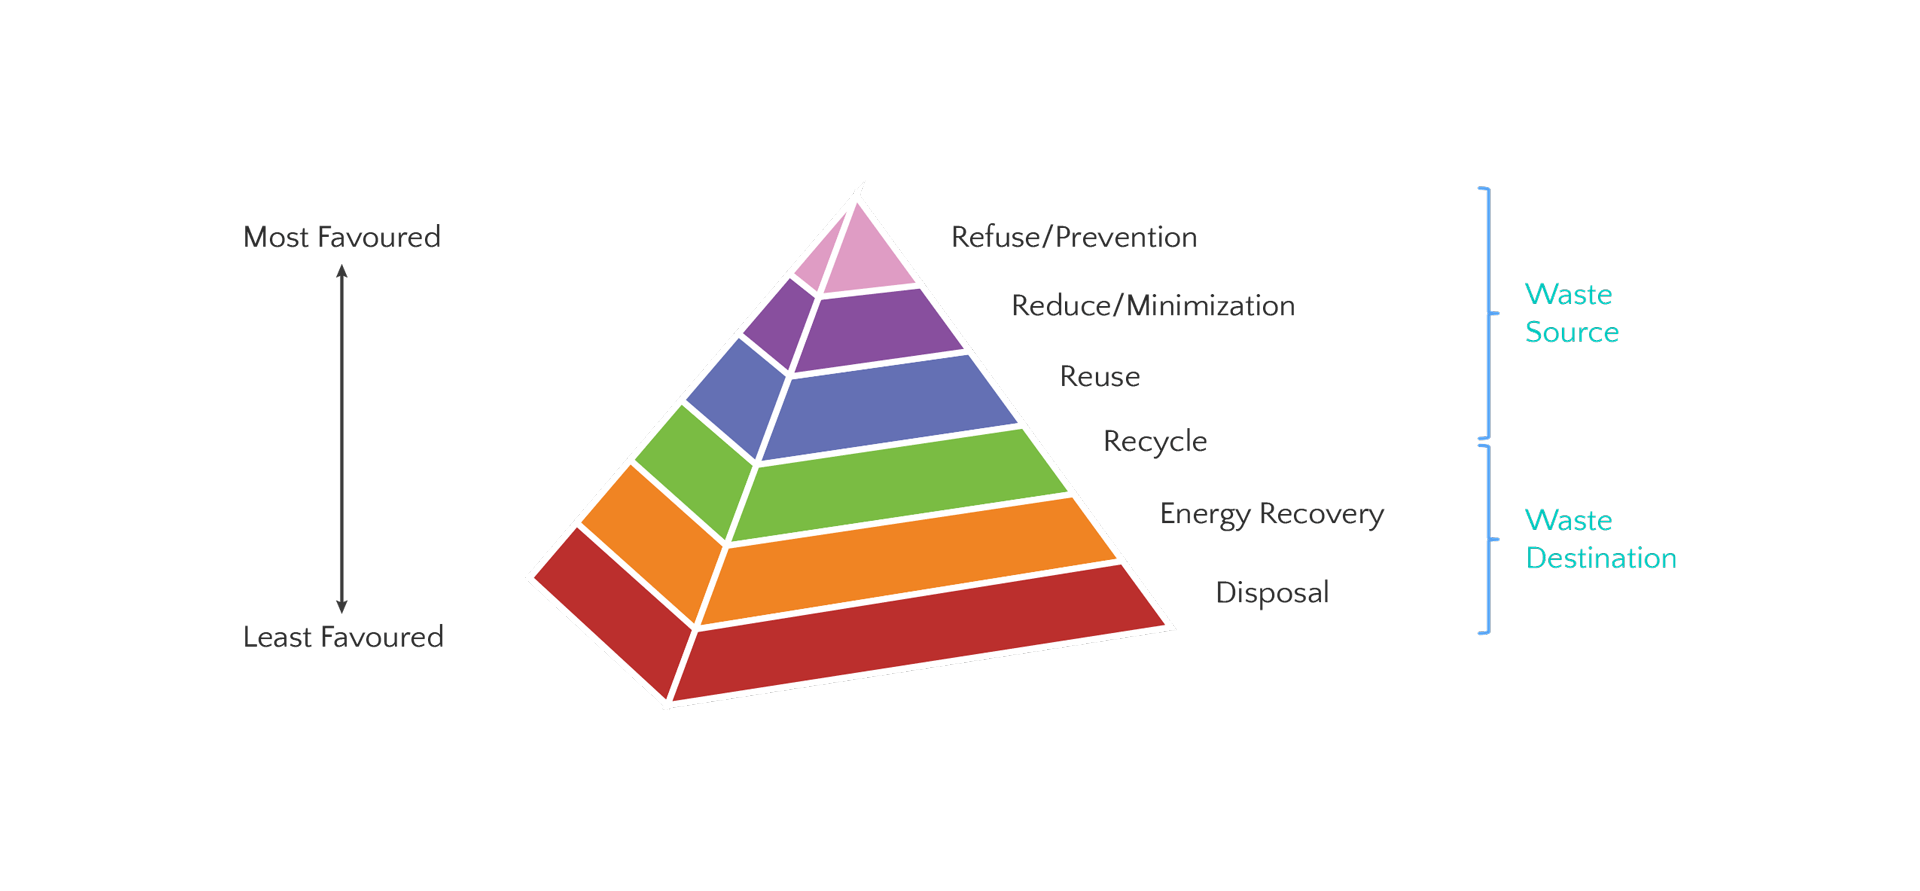
Cities are now facing more rapid population growth, and shares in GDP growth, resulting in a change in income levels, and with that also in urban life style and resource consumption patterns, which, in turn, has increased the volume of municipal waste. UNEP’s Integrated Solid Waste Management (ISWM) strategically proposes to promote an integral approach towards the peak of the Waste Management Hierarchy, the 3Rs, namely Refuse, Reduce and Reuse.
We, consumers, are often unaware of the waste generated by us on a daily basis and its (ripple) effect on the entire Solid Waste Management System. 
We, consumers, often learn a lot of things related to proper waste management and responsible consumptions through schools, radio, TV, newspapers, etc. mediums, but we fail to positively impact the system because we don’t practice those learnings. There is a tendency to ignore or overlook.

The Conundrum?
Increasing Consumerism

The ISWM hierarchy understandably prioritizes waste minimization at source because it is the most effective way to reduce the quantity of waste, handling costs, and its environmental impacts. Hence, targeting the waste generating source where bulk of our waste is generated, i.e., household consumers, and with a special eye on our future, promoting and educating the households, especially children, about the importance of the 3Rs of ISWM for responsible and sustainable living practices, is possibly the big opportunity.
Design a behavioral awareness mechanism at households to minimize/prevent waste generation at source through conscious decision making.
•30-35 years old.
•Married with 2 children in primary school.
•Dual income household.
•Lives in well facilitated housing society.
LIFESTYLE
•Tends to practice and live healthy lives.
•Supreme importance to their family’s welfare.
•Often participates in social & community gatherings.
•Social existence mostly revolves around wealth and material possessions.
•Acts responsibly to always develop the right habit for the children to learn.
•Relatively keeps themselves aware about the various trends driving the world.

•Online shopping of goods is a prevalent practice in the family.
•Prefers visiting the super markets on weekends for grocery shopping.
•Emphasizes on expenditure patterns but naturally unaware of their consumption patterns.
•Children learn about waste management, global warming problems at schools but often doesn’t practice the learnings at home.
•Responsible enough to practice Waste-to-Bin system at home but typically oblivious to the larger impact of such generated waste.
•Prefers home food but hectic work schedules for Mr. & Mrs. Gupta often lead to ordering out and the children apparently enjoys eating out more often than not.

Waste Footprint

We often talk of carbon footprint and ecological footprint which traces our impact on the earth and climate but one impact which needs to be traced today is our Waste Footprint. Put simply, this is the environmental, economic and social impacts that results from the waste we create. Virtually everything we consume creates waste throughout its lifecycle. Our Waste Footprint is very visible, aluminium quarry lands or the landfill sites or the harmful gases of the incinerator plants or the rising temperatures.
The idea is to quantify waste created by any individual and generate a Waste Footprint Index (WFI). The core of this project looks into our future and hence is driven by various mega & macrotrends of the world:


Track consumption and waste generation patterns of a household.
Analyze the consumption data, categorize and deduce the waste footprint index.
Represent the information to create a behavioral awareness mechanism.

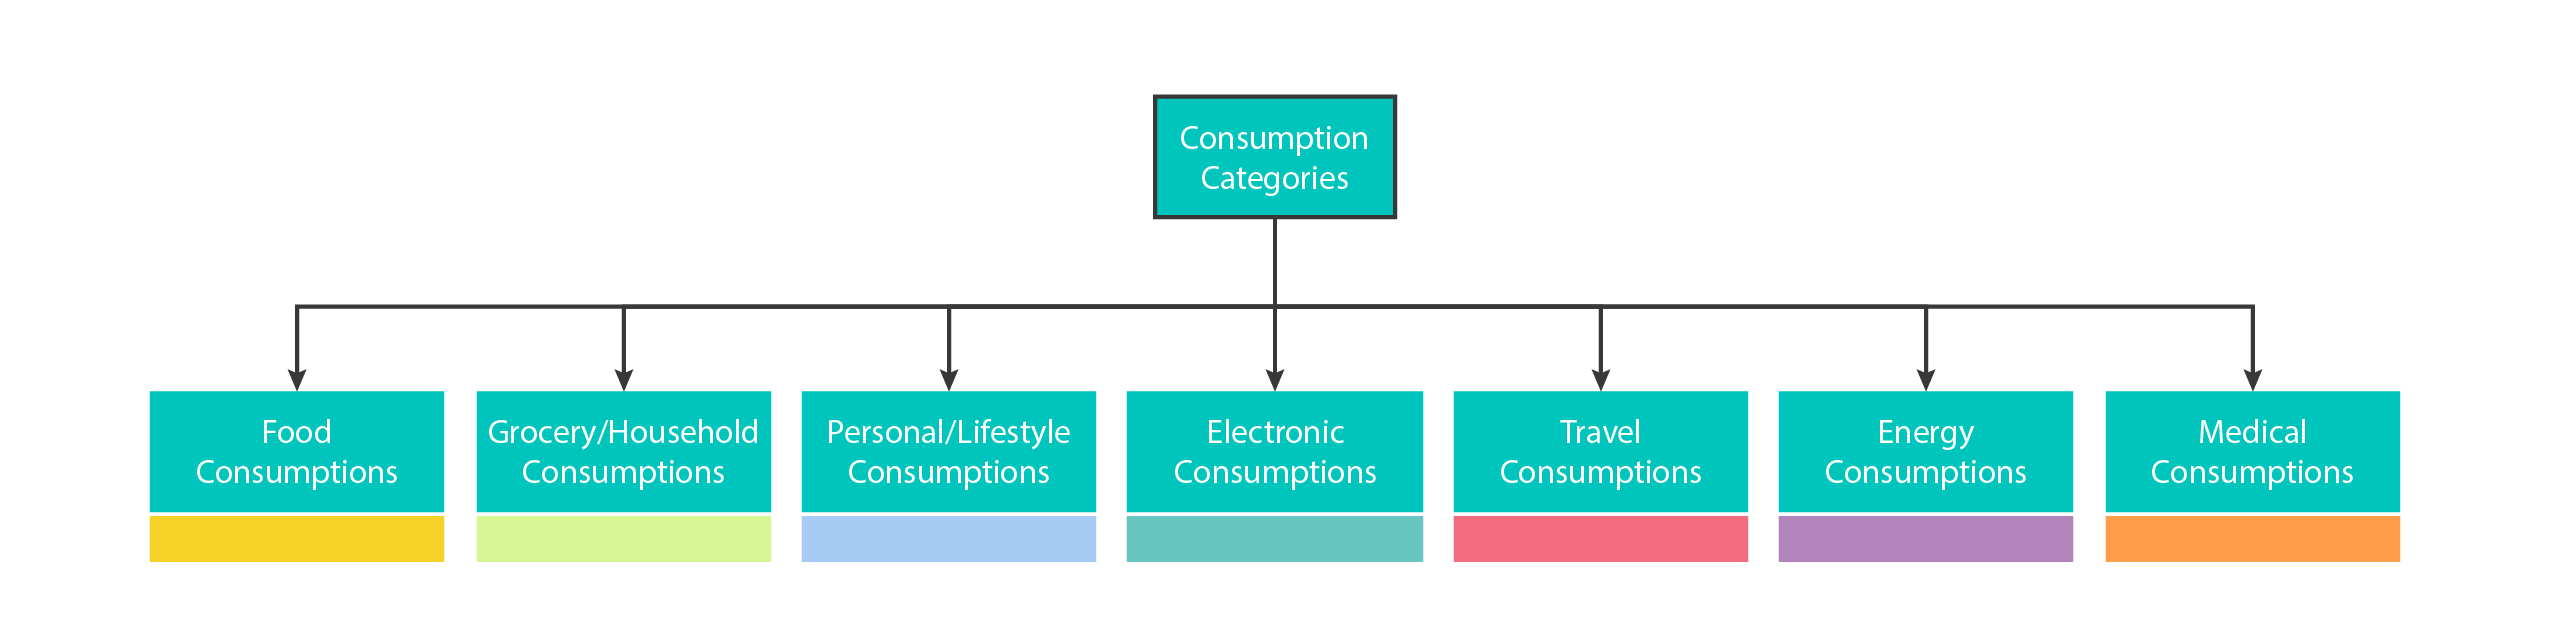
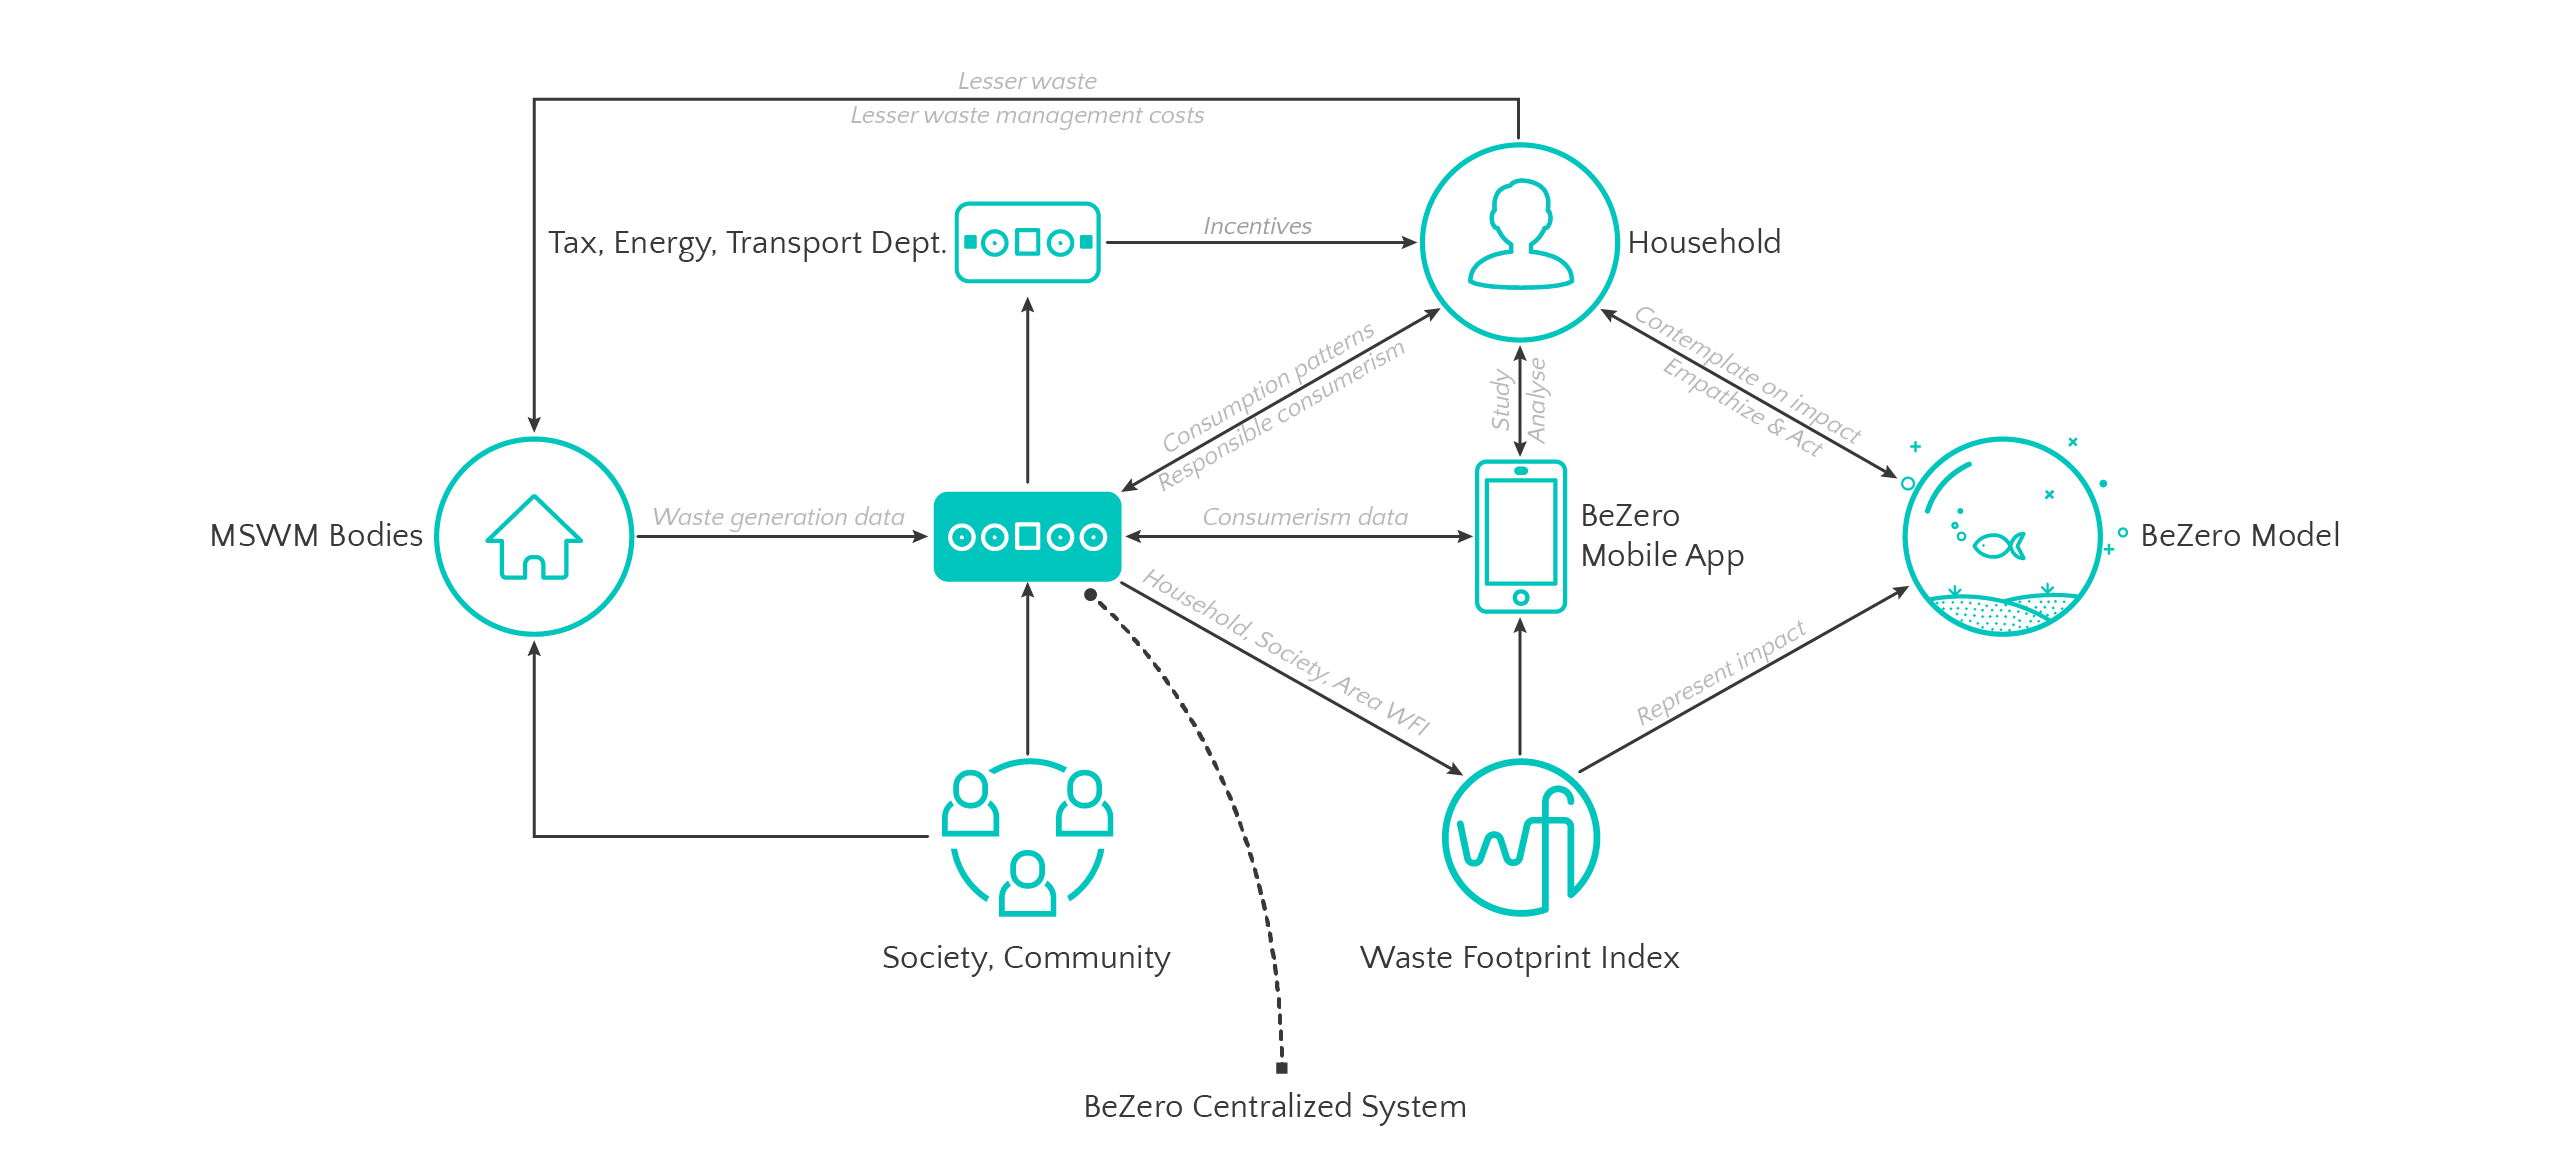
To track consumption patterns of any individual, it was important to do an affinity mapping of various consumption sources and consumption categories and thereby find ways to accumulate all segregated data to a centralized system.

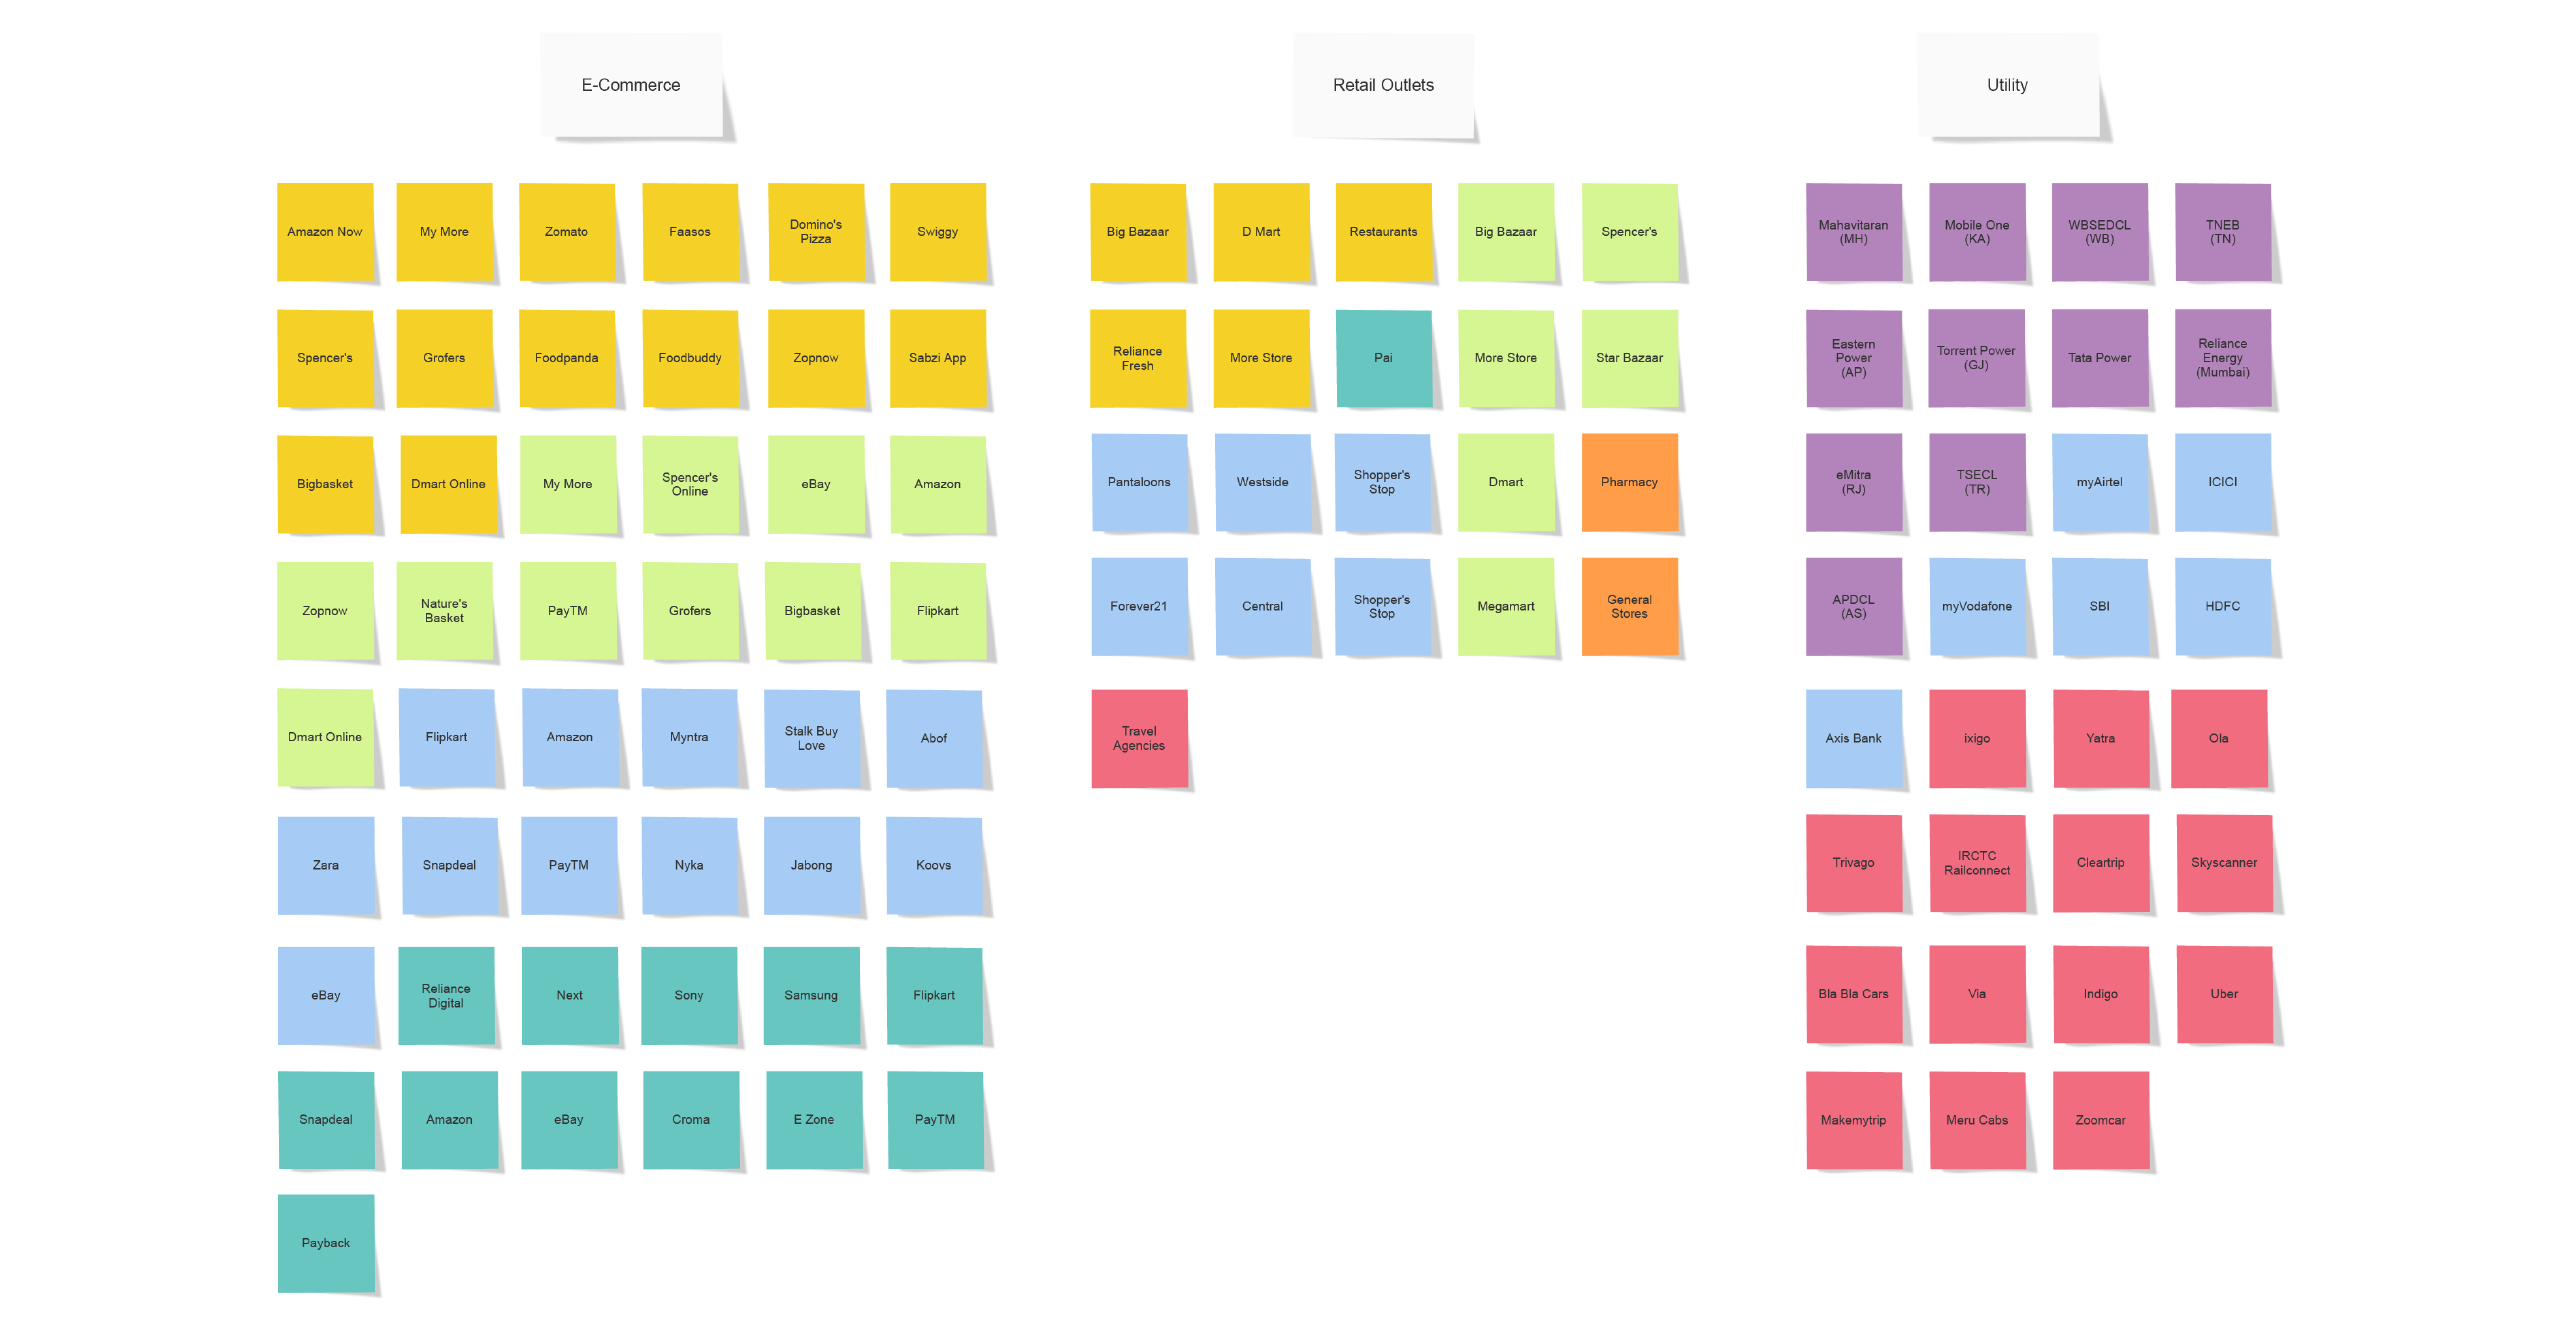
Today, as we move towards an era of data and a more connected world, every customer/consumer is identified by an user profile through his/her mobile number or email ID at every store, such that, each of these databases know what a certain customer has consumed from a store. If all stand-alone databases can be comprised into a central database, the system can then aggregate a consumption history for a particular customer over a period of time and provide a total consumptions value for that individual.
Deducing a waste footprint index would also require tracking of waste generations and that can be achieved through an improved data collection system from the NGOs, Waste Traders, SHGs and municipal bodies who provide the per capita waste generation value through census data.

Plastic Disclosure Project (PDP) is a project to reduce the environmental impact of the world's rising use of plastics in products and packaging. It was announced at the Clinton Global Initiative (CGI) in 2010 by Ocean Recovery Alliance, a Hong Kong and California-based non-profit organization.
They believe in the theory: If you don’t measure it, you can’t manage it.
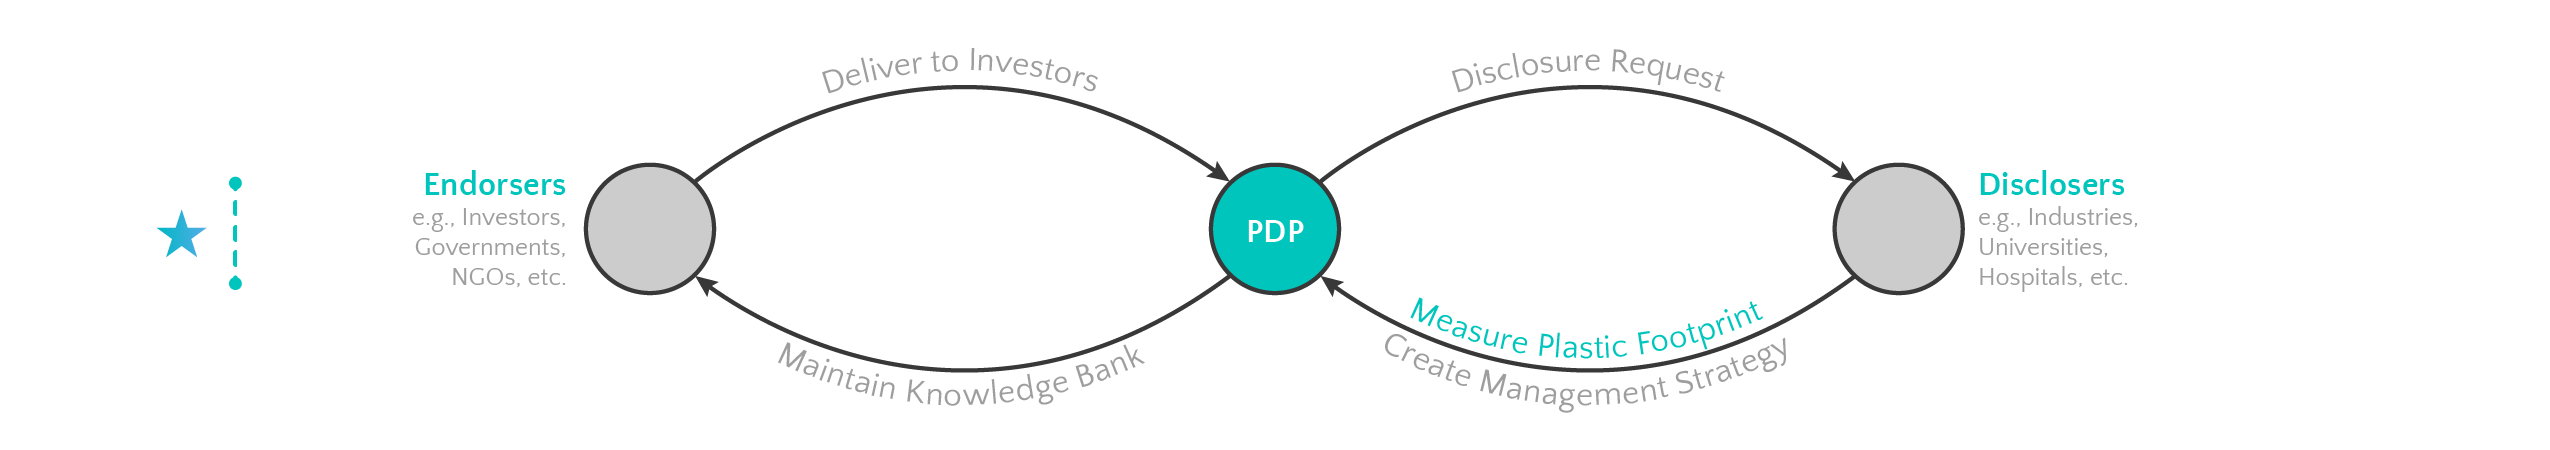
As per section XX(Y) of BIS, all companies producing and selling any goods ranging from industrial to food items, should quantify the actual composition of the product in terms of Plastic, Metal, Paper and Inert, and declare it in the after purchase customer invoice.
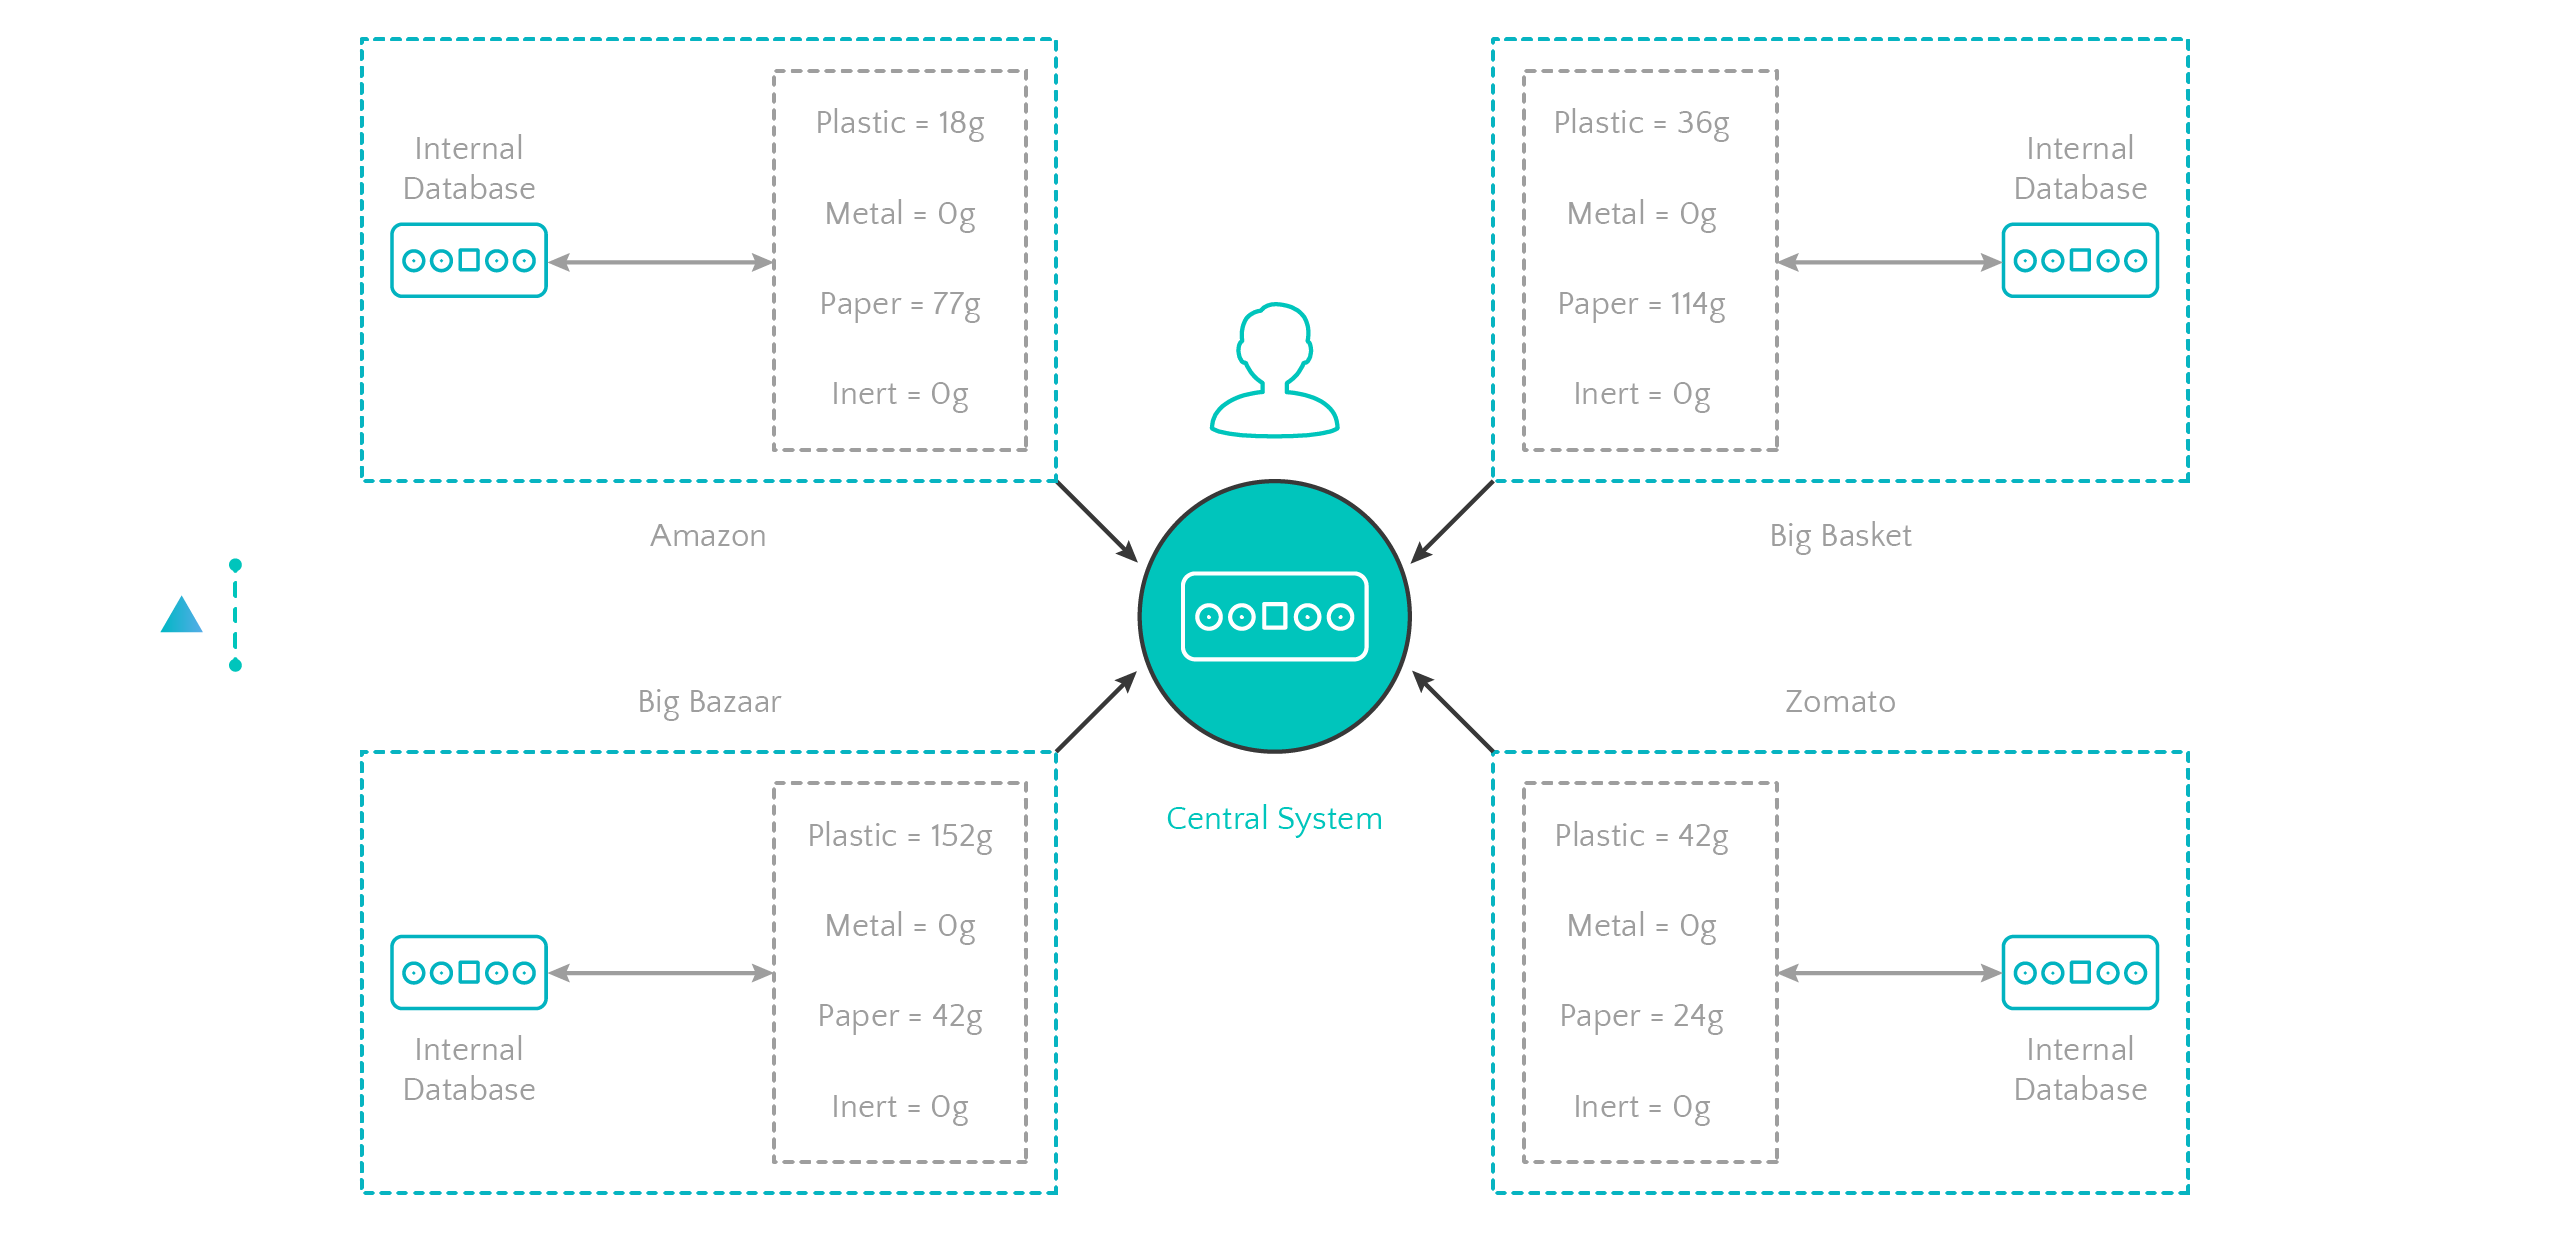
With this assumption of the law being passed by the highest authority (in the future), the central system now knows an individual’s consumption in terms of a more effective quantity. Thus, every individual’s consumption and waste generation data is aggregated and compiled for multiple individuals to form a family.

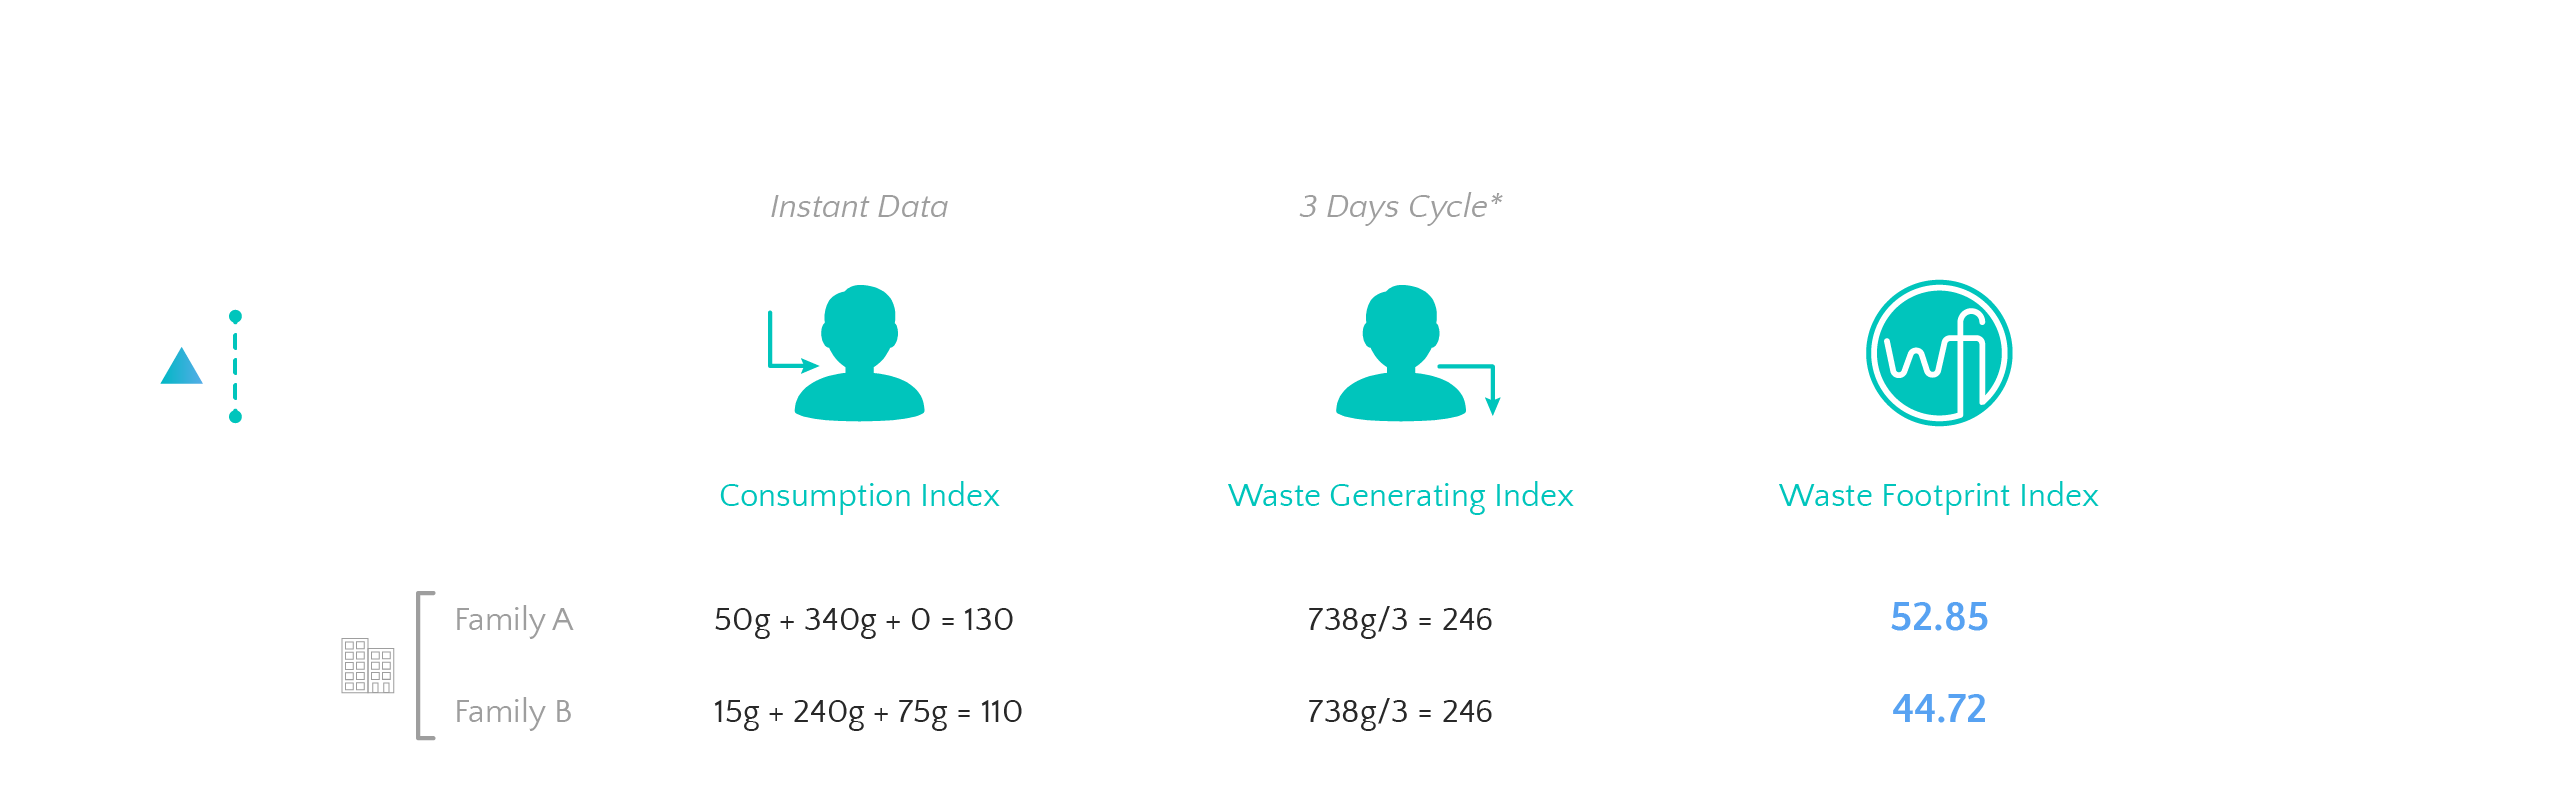
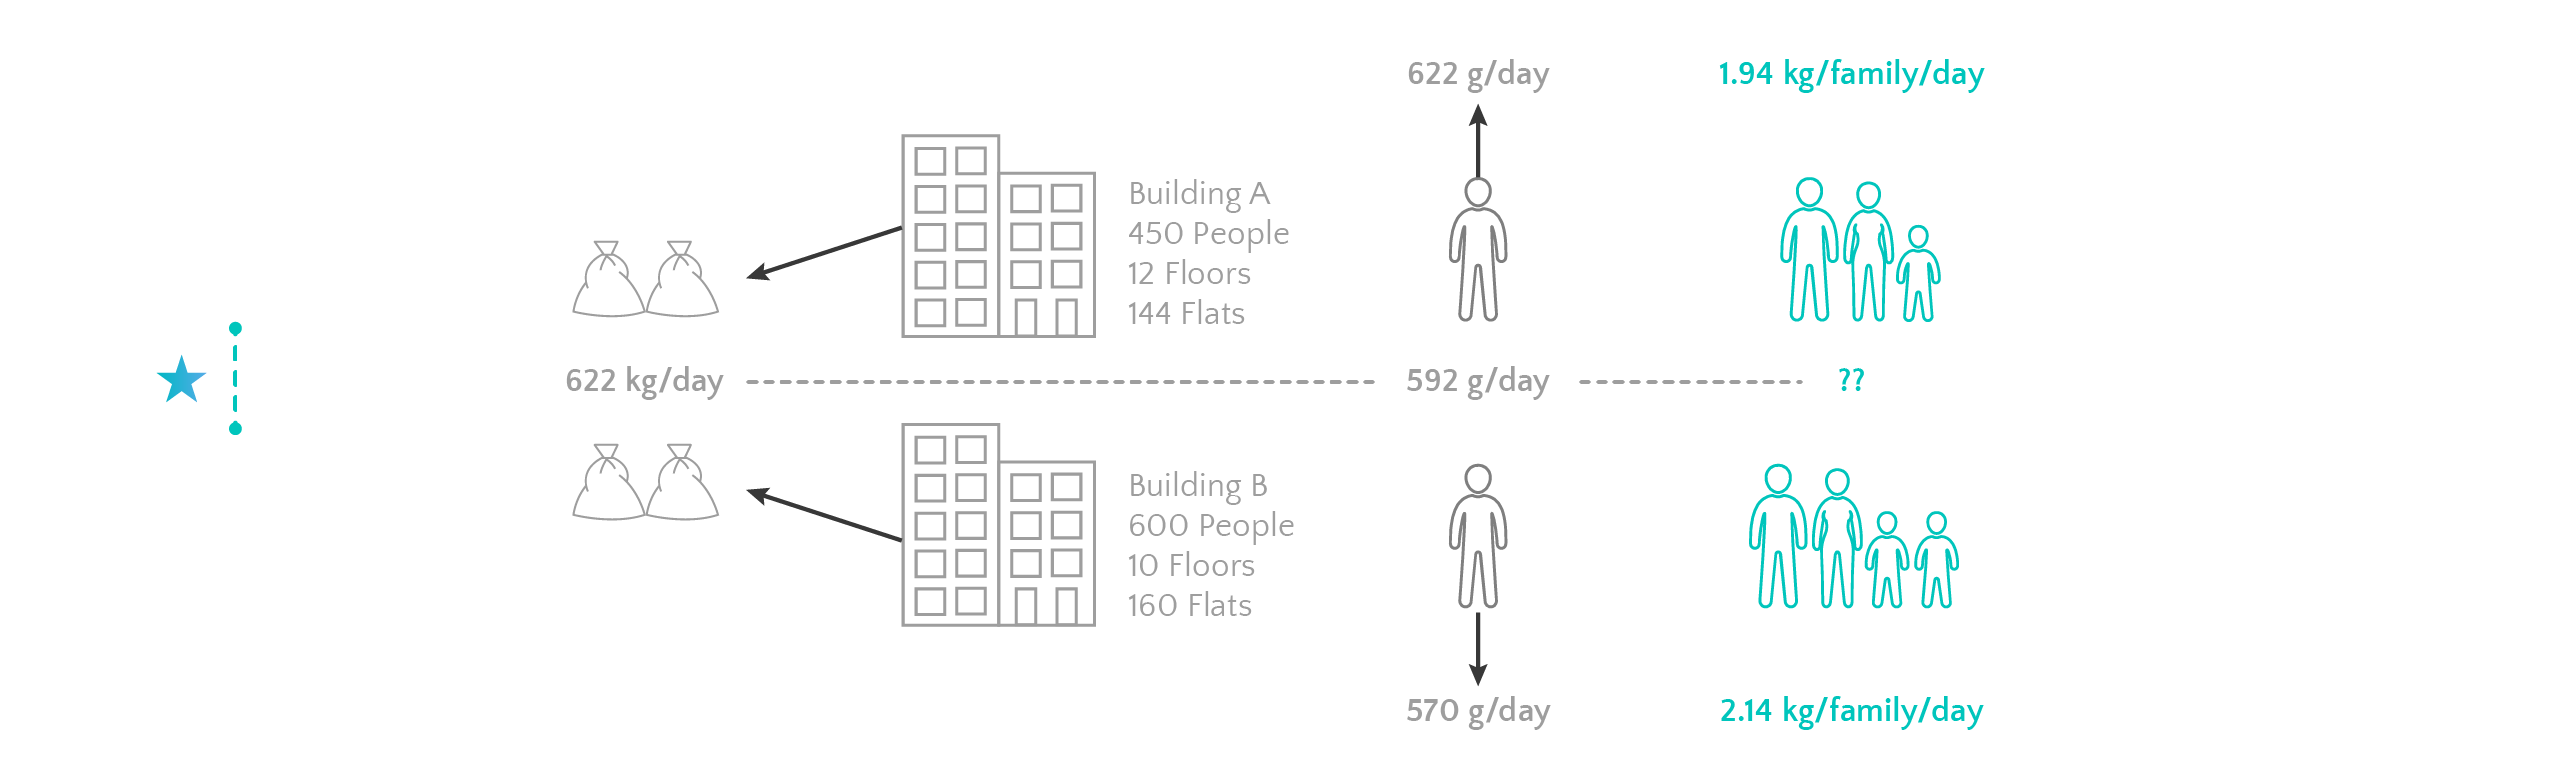
*as per municipality’s waste collection cycle for a specific building/area/locality/unit.
**The WFI generation method mentioned above is intended to provide a heads up approach and in all probability,
will require further in-depth analysis to make this index value more accurate and impactful.

Representing the Waste Footprint Index is among the integral part of this project since the sole purpose of this project was to create a behavioral awareness mechanism in a household and also address our future generations, the children, who can understand and learn about the impact of such increasing consumerism on our SWM system and thus develop a conscious decision making tendency for a better world.

Emulate nature to represent the impact of our consumptions and waste generation patterns.
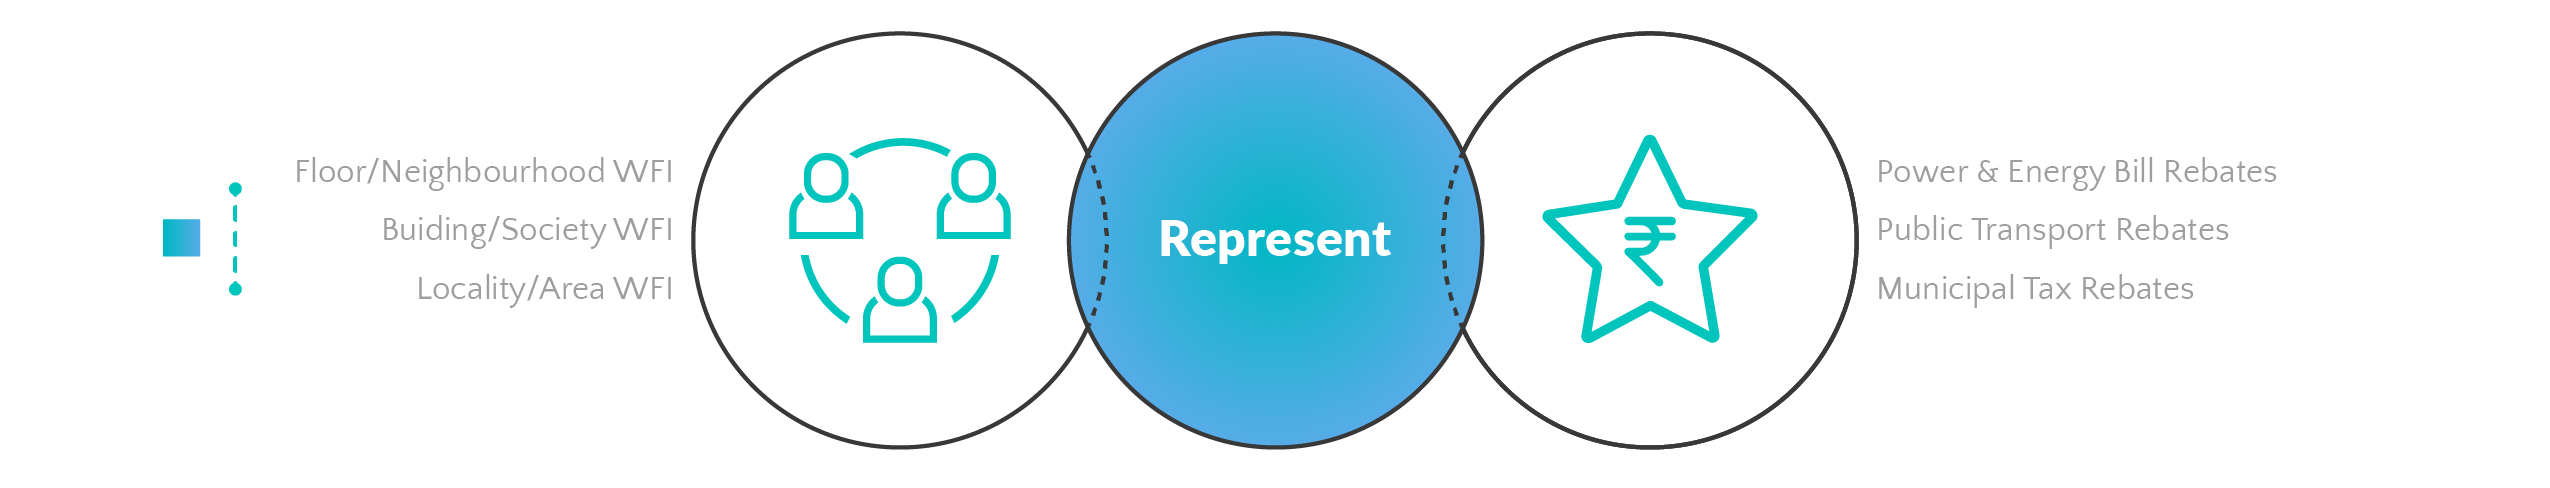
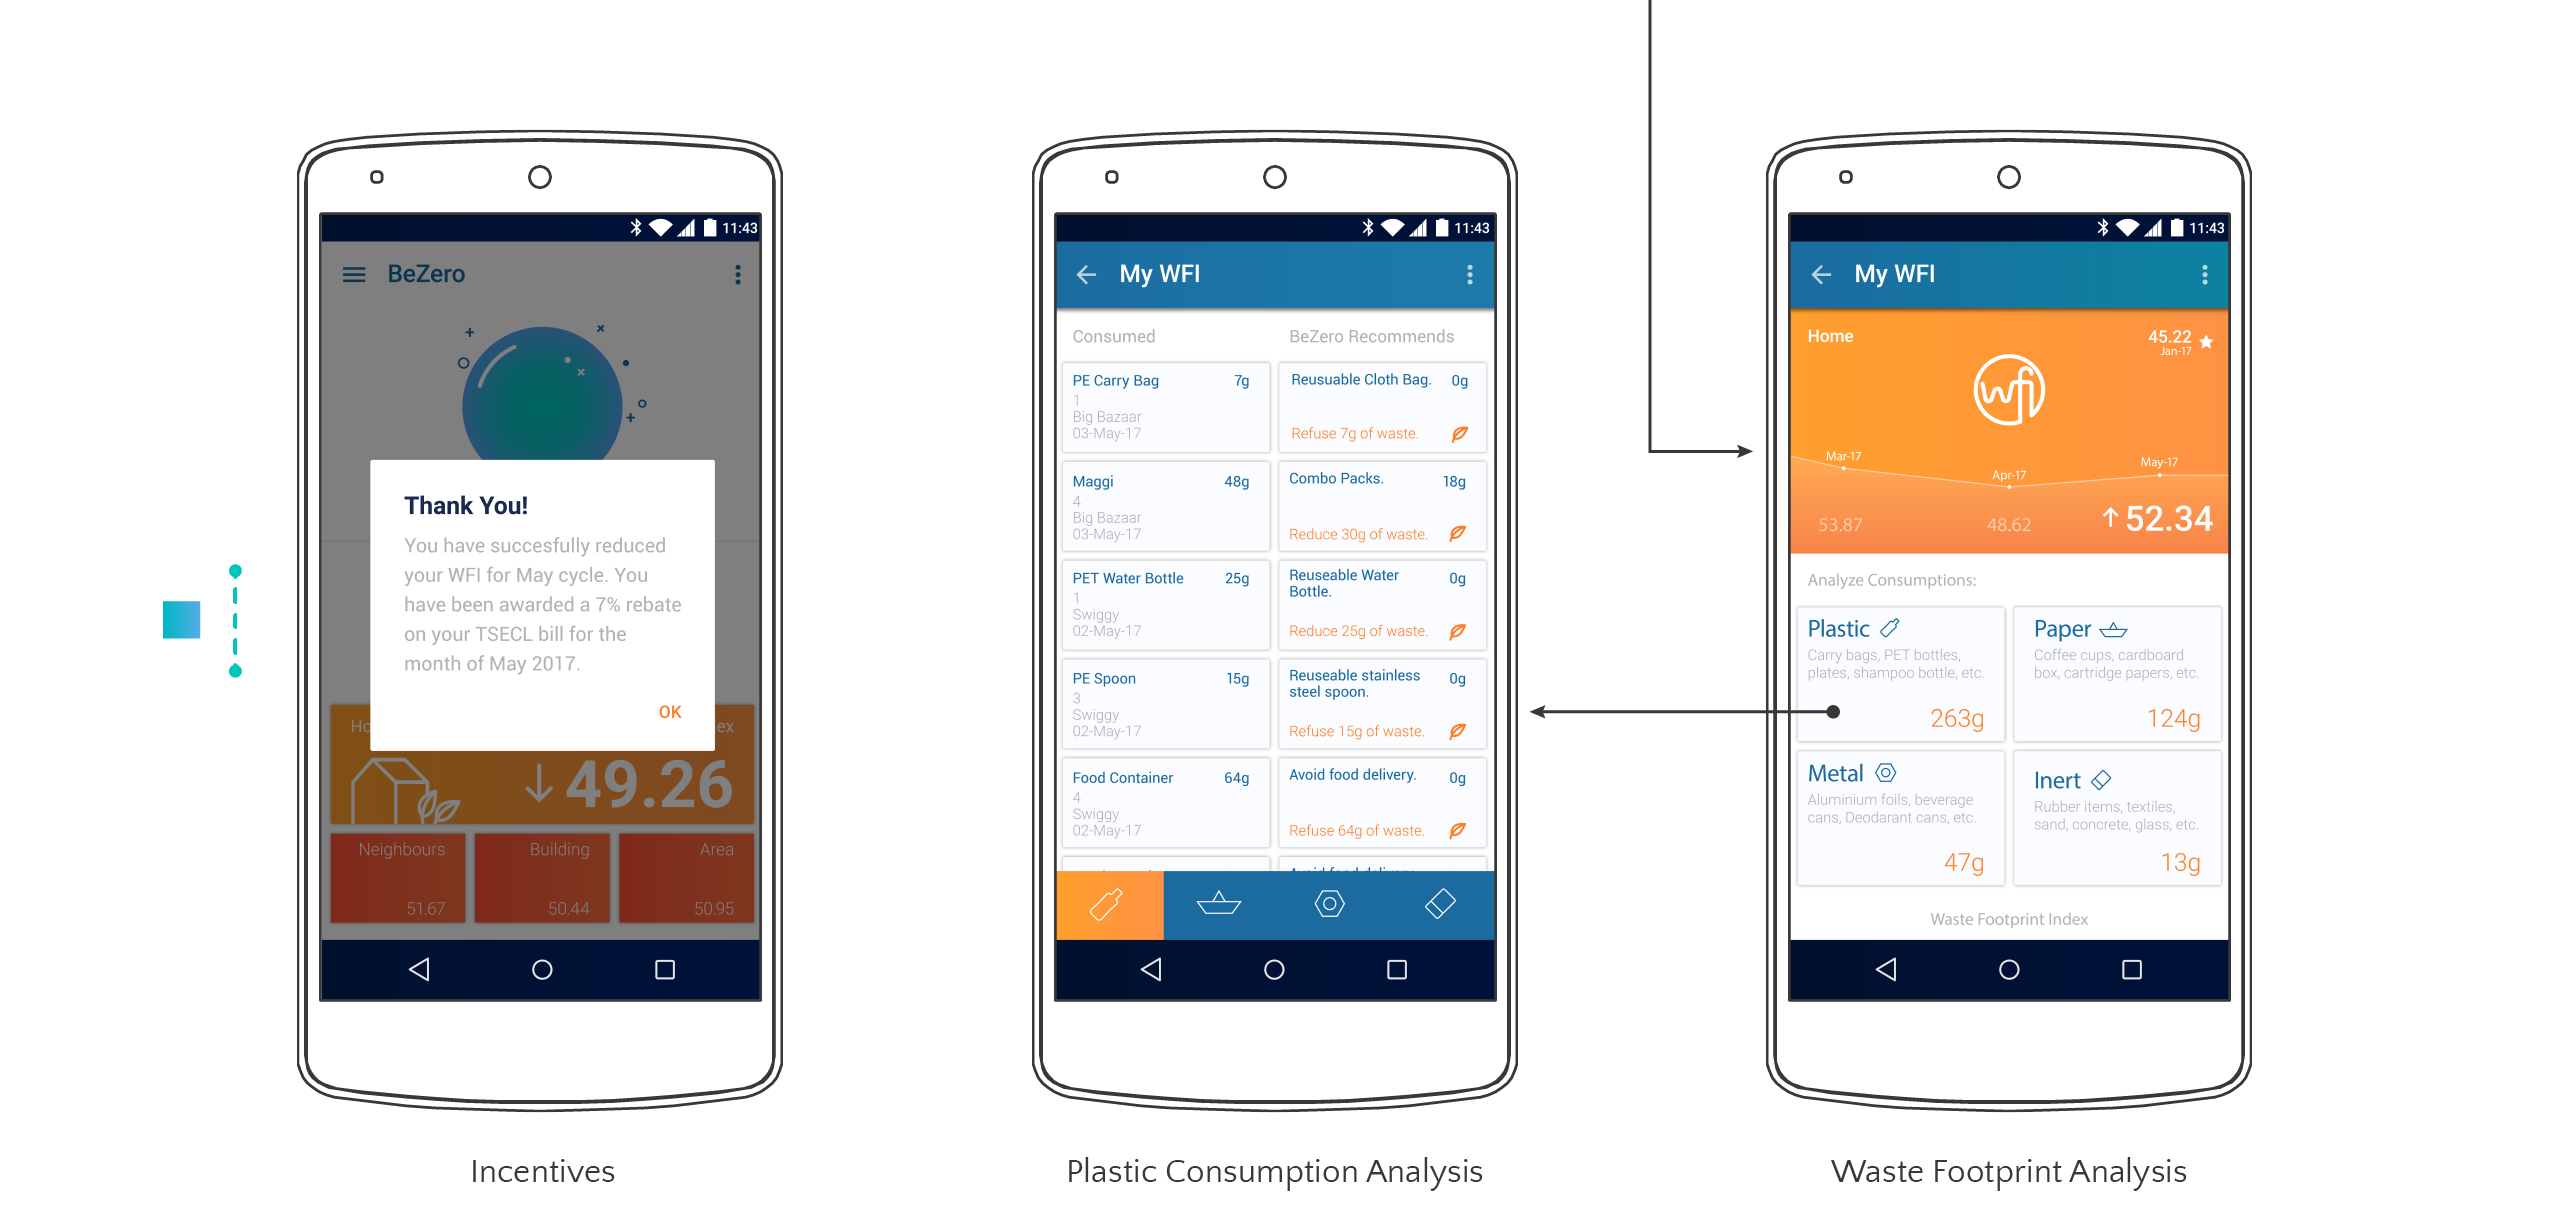
Use Social Stigma and Incentive Centered Design to encourage and appreciate a family’s WFI improvements.

Create a sense of delight, care, love, fun through the representation and also keep the children at households interested so that they understand and practice to help their parents improve their family’s WFI.
 Xylem Gauge
Soil Pollution
The vascular tissue that transports water & some nutrients from roots to shoots and leaves of a tree.
LED pipes represent the xylem tissues.
WFI values are represented through colors of soil pollution:
Green = Low
Yellow = Medium
Red = High
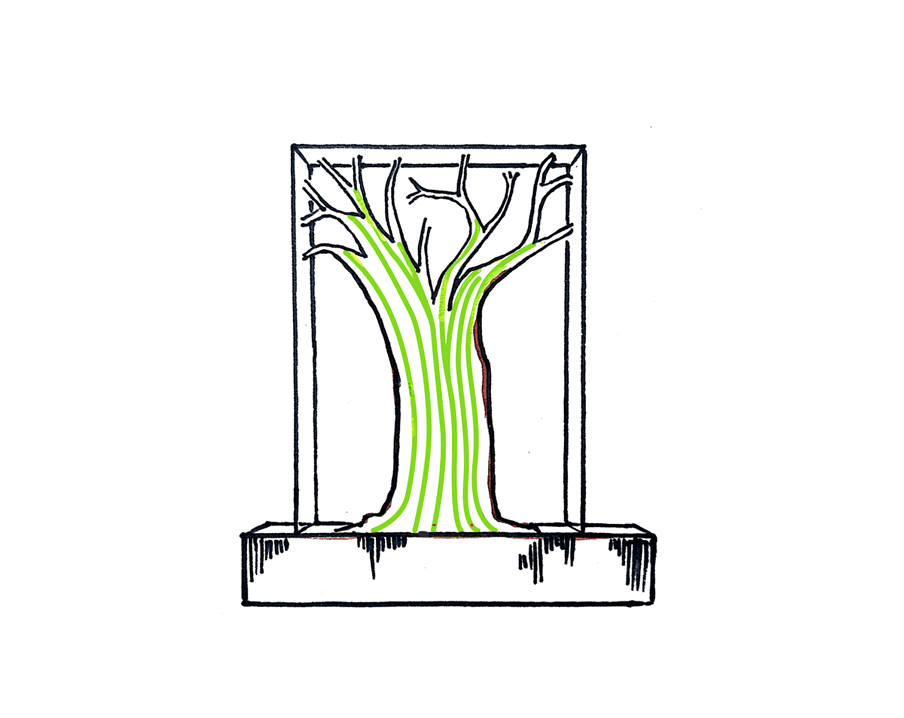
Soil Pollution

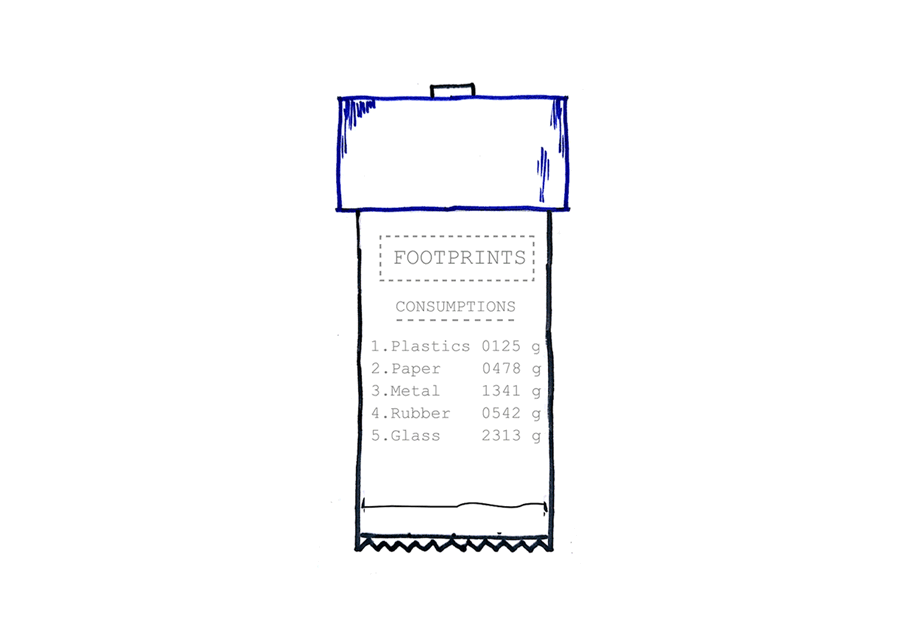 Metaphor - Invoice Generator Terminal
A digital display representing consumption data as a bill which animates and falls down to the ground.
The ground represent our landfills, soil pollution, where WFI values of the household, building/society, area/locality are displayed.
StoopySoil Pollution
A WFI value controlled mechanical flower plant which folds and stoops according to rising values.
WFI values are represented through the colors of the LED stem. The colors of soil pollution:
Green = Low
Yellow = Medium
Red = High

Water Pollution
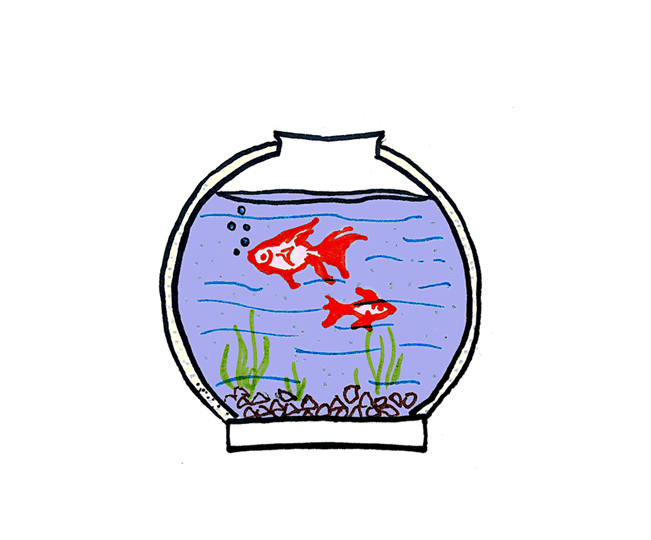 Metaphor - Fish Tank
A turbidity controlled zone in the exterior chamber of an actual fish tank.
WFI values are represented through the turbidity of the fish tank referring to water pollution.Higher the WFI, higher the turbidity, lower the visibility of the fish in the fish tank.
Fishes remain safe in a different chamber.

❤ Fish tanks are quite amazing. We, humans, have a very natural attraction towards water and children associate a lot of happiness with fish tanks by simple gaze and science says, it creates a calming effect. If you’re into feng shui, you probably know that placing a fish tank somewhere in your home gives you wealth or money luck.
OrbuscryAir Pollution
Hover hand over the ball to see the future nature.
Various clippings from immediate natural surroundings and nature are projected in the globe.
WFI value controlled smog represents air pollution in the immediate environment.
Higher the WFI, denser the smog, lower the visibility.

❤ The 3D Crystal Ball, often associated with fairy tales and magic, has always fascinated children and for years now many have only dreamt of a true 3D display. Research is active across the globe to make this overwhelming experience a reality soon and one such reference is “The Return of the 3D Crystal Ball”.
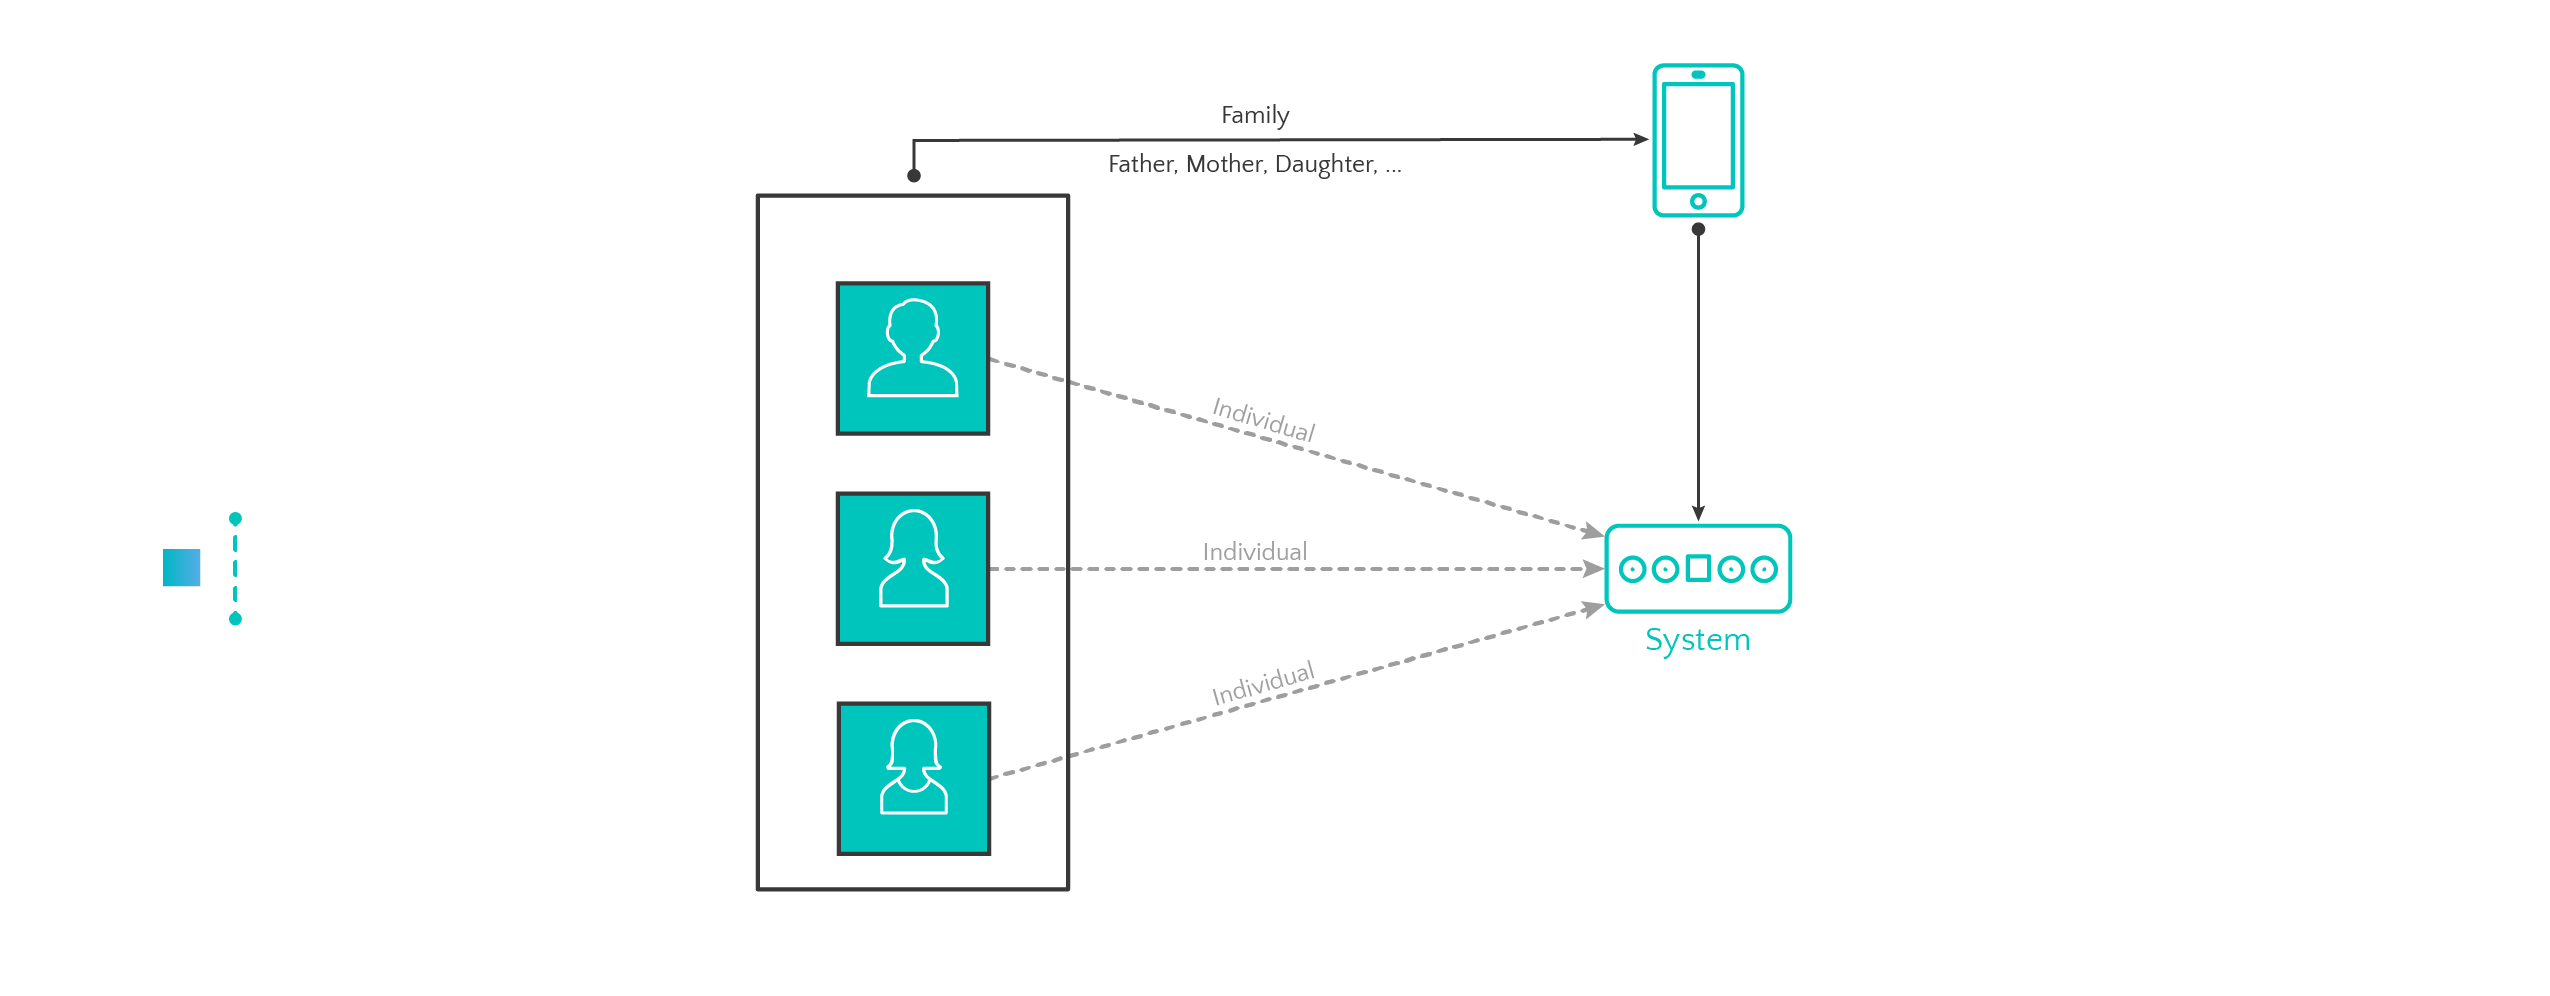
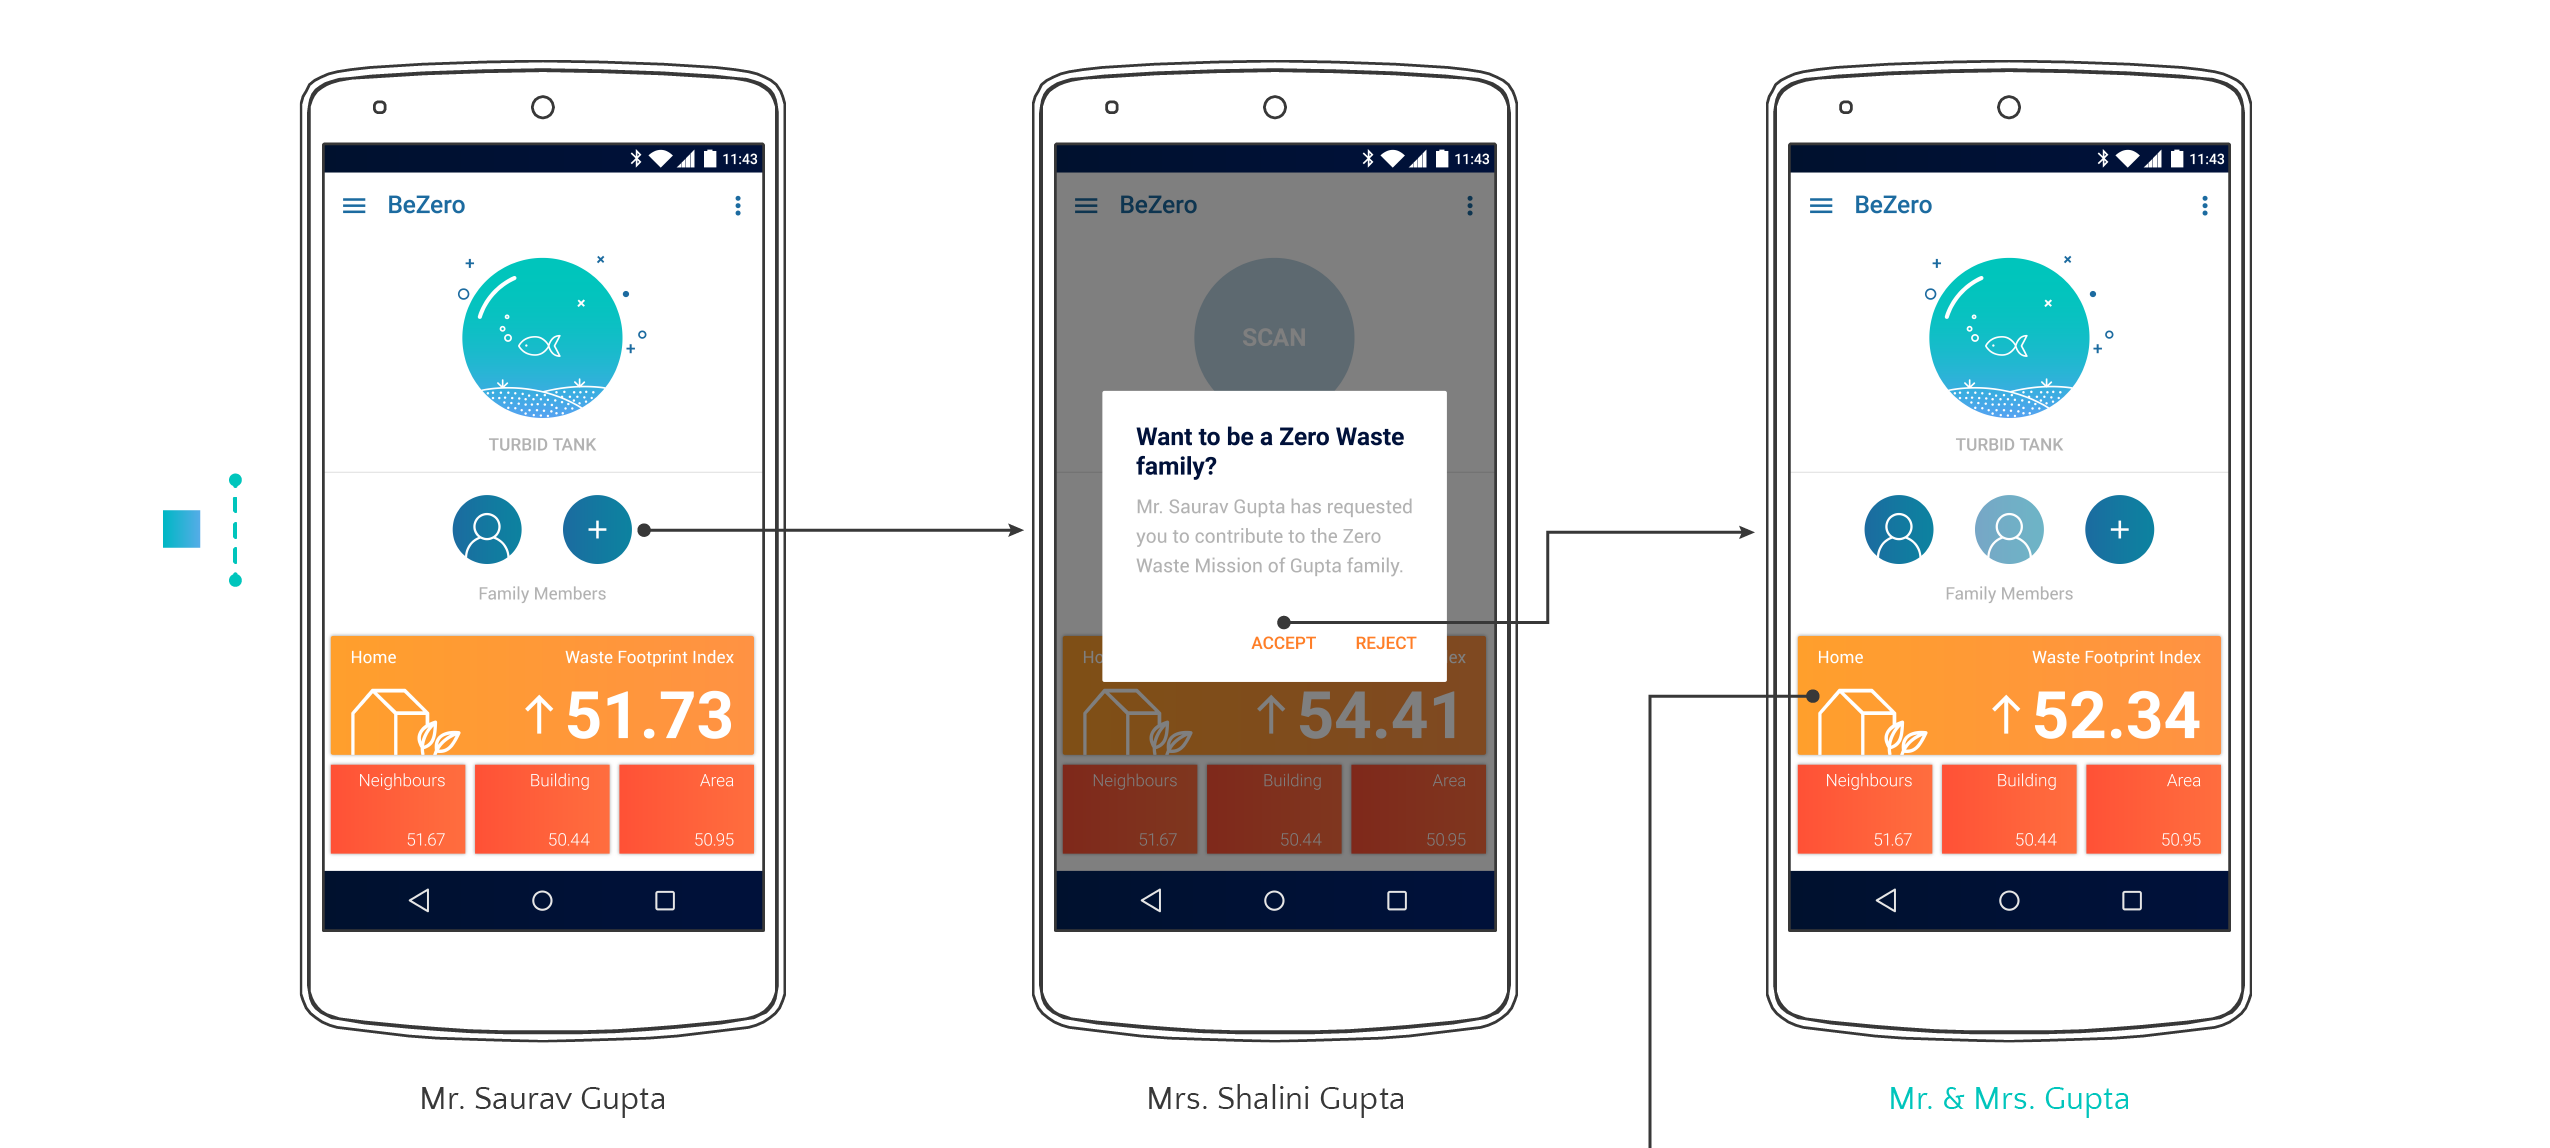
So far, BeZero has directly connected all the individuals to the centralized system database and henceforth everyone has an individual WFI. However, the project had to bring the family as a household into the system and generate a family WFI. How?
The BeZero Mobile Application here provides a platform for every individual to form his/her family. It also serves as the complete data analysis centre and also for recommendations and suggestions.

While BeZero believes that introducing a concept of Waste Footprint Index to quantify our increasing consumptions will create a more transparent and responsible consumption mechanism in our future, it also promises to create various other design opportunities which will further improve our Solid Waste Management systems. E.g.,

Scope for new packaging solutions in retail sector.

Scope for new service design models in e-commerce sector.

Scope for new sustainable green product designs.
Scope for innovative design solutions in production stream.
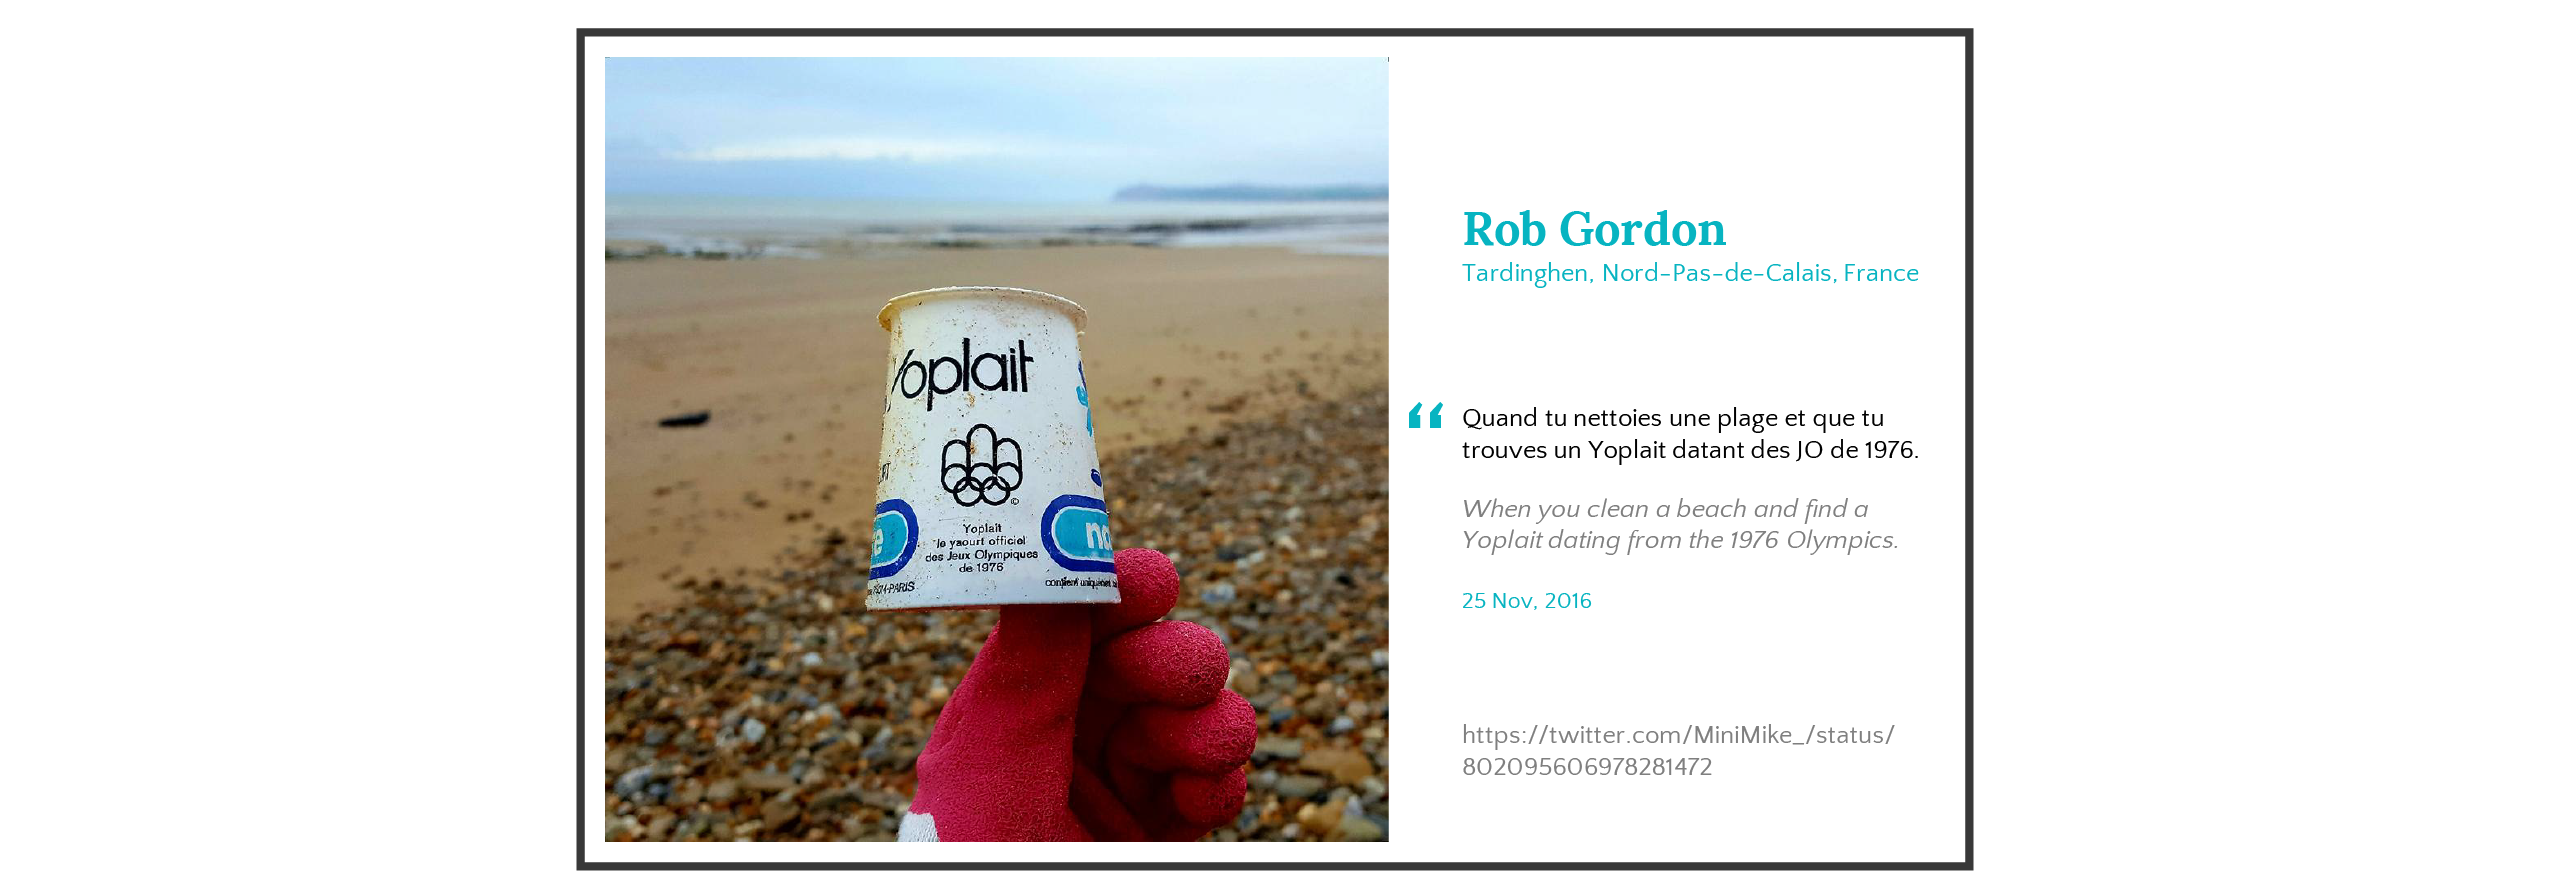
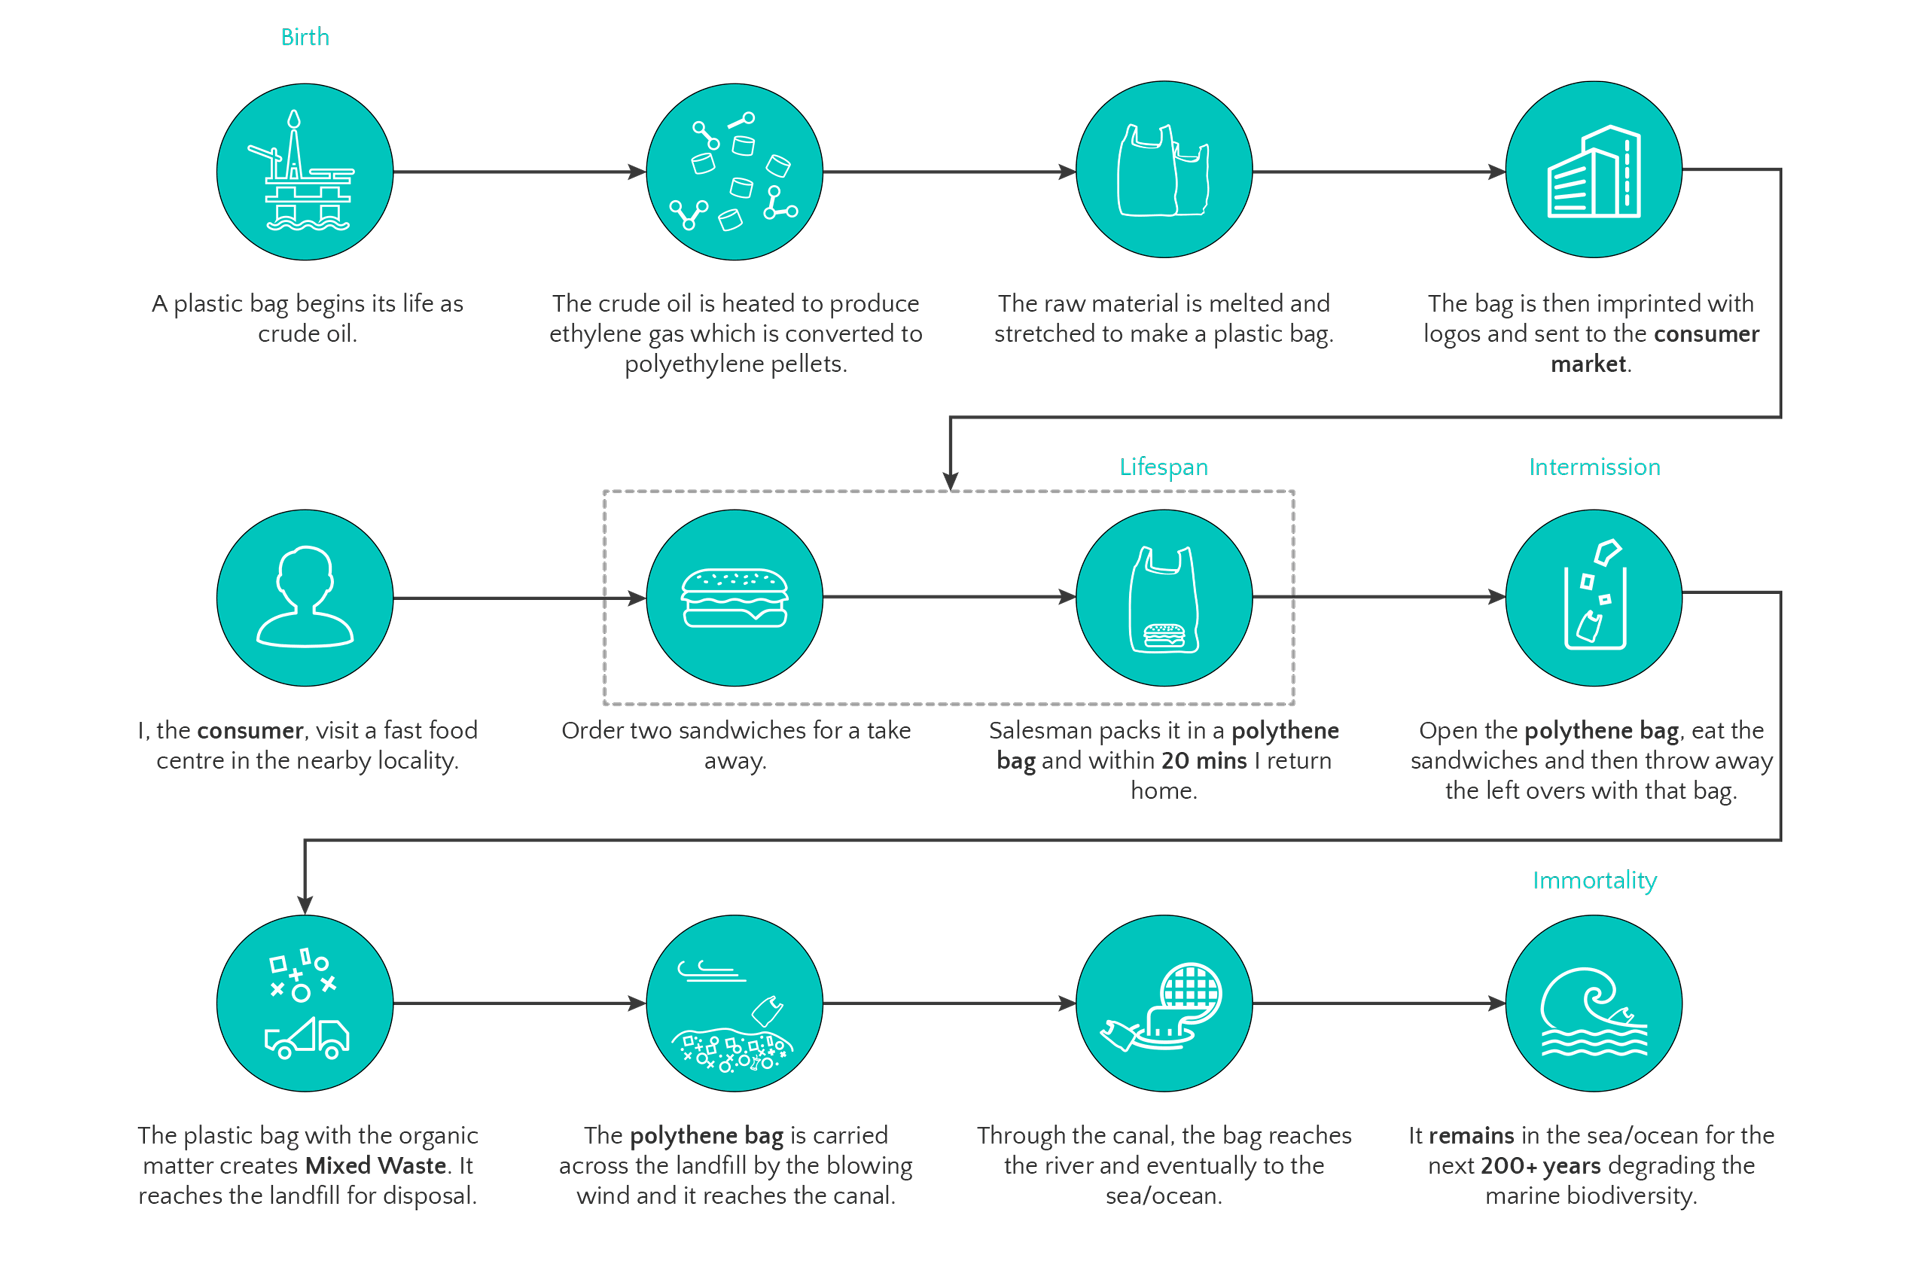
A Yoplait cup from the 1976 Montreal Olympics, still very crisp and very much undegraded, washes ashore in France crossing the North Atlantic after 40 years. Scary isn’t it? All such irresponsible consumptions and dumpings of mankind are alarmingly becoming immortal waste footprints. Let’s be responsible, Let’s BeZero.
My vocation is to shatter misconceptions associated with the Zero Waste lifestyle, to prove that waste-free living cannot only be "stylish", but also lead to significant health benefits, and time and money savings.
Bea Johnson
Mill Valley, California, USA
www.zerowastehome.com
Adobe Illustrator
Adobe XD
Realtime Board
MarvelApp


This work is licensed under a Creative Commons Attribution-NonCommercial-NoDerivatives 4.0 International License. © All Rights Reserved 2019.

